Choose your operating system:
Windows
macOS
Linux
When working with Blueprints, there may be instances where something is not working the way you had planned it to. To diagnose these problems, the Blueprint Visual Scripting Tool comes with its own debugger and one of the most powerful aspects of it is the ability to add Breakpoints to nodes in your graph. By adding Breakpoints to nodes in your graph, you can play (or simulate) the game normally in the editor, then when reaching the node you have added a Breakpoint to, the game will pause and jump to that node in your graph so that you can step through your script to see where issues are occurring.
Another useful debugging feature is Watch Values , which allows you to mark a variable in your Blueprint (or multiple variables) to Watch which will allow you to see their values inside your Blueprint while the game is running. This is essential for debugging incorrect calculations or values for your variables as you can visually see where the error is coming from as your variables change in real time.
On this page, you will learn how to set up a Blueprint for debugging as well as other methods used for diagnosing problems.
For more information on debugging with Blueprints, see the Blueprint Debugging documentation.
Enable Debugging
To Enable Debugging of a Blueprint, you must first specify the instance of the Blueprint you wish to debug that is in your level.
Inside your Blueprint, click the Debug Object drop-down menu, then select the instance you wish to see in the debugger.

Once you have an object selected, you can jump to that object in your level by clicking the magnifying glass icon.

When you play in the editor, with your Blueprint up in another window, you should see the pulsating "Active Wires" as your script executes.
In the example above, there are two fire effect Blueprints in the level each set to different times to deactivate themselves. On Event Begin Play (when the game is launched), a Delay node is used to Deactivate the fire and its associated sound effect after a variable specified time.
You can see in the left window that the script executes when the game is launched (as the pulsating wire leaves the red Event Begin Play node and enters the Delay node). After the specified time, the pulse is shown entering the third node which is used for deactivating one of the fire effects.
Breakpoints
To add a Breakpoint to your Blueprint script, Right-click on any execution node choose Add Breakpoint .
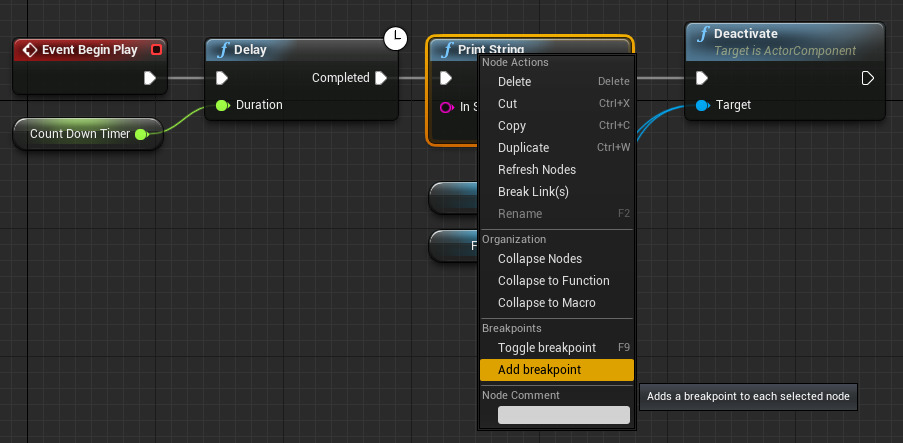
Instead of the Right-click method, you can press F9 on a selected node to toggle a Breakpoint on or off.
When a Breakpoint has been added to a node, a red circle will appear in the upper left hand corner of the node.

During gameplay, when the script gets to this point, the game will pause and focus on this node.
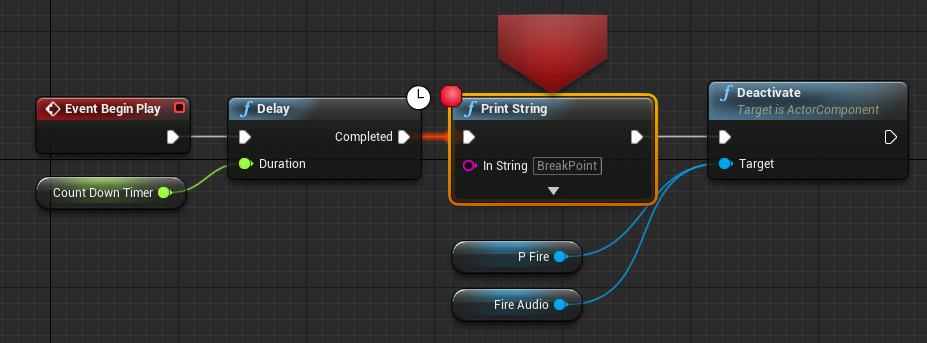
You can also temporarily disable a Breakpoint to keep track of which node(s) previously had Breakpoints assigned.

A node that has a Breakpoint set to disabled will ignore the command to break when reaching the node.
There is also an option from the Debug menu option to Disable/Enable or Delete All Breakpoints .

Debugging Controls
When a Blueprint has reached a Breakpoint, additional control options become available for navigating your Blueprint script.

From left-to-right above, Resume allows you to resume gameplay inside the editor and exit debugging mode. Frame Skip allows you to advance gameplay ahead by a single frame, while Stop stops the play in editor session completely. The Find Node option allows you to jump to the currently active node from the gameplay session while Step advances to the next node in the current execution flow.
When you place a Breakpoint on a node then start the process of stepping forward through your script, when you reach the end of your current execution flow, you will automatically be returned to gameplay.
General workflow for debugging consists of adding a Breakpoint to a node, then using Step to progress through your script to identify where things are going wrong. You cannot step backwards, so keep this in mind when placing your Breakpoints and try to place them before your issue occurs so that you can see what is leading up to and after your issue arises.
Watching Values
To watch a variable's value, Right-click on a variable and select the Watch this value option.

When you have selected to watch a variable, anywhere that variable is accessed the magnifying glass icon will appear.

You will also see floating text bubble appear above the variable which shows the variables current value. When you play in the editor, if this variable should change, it will be reflected in the text bubble as well, allowing you to see it change and its current value. The option to watch a variable is not limited to numerical based variables, any variable can be set as watched allowing you to see its value (as seen below where a Boolean variable is also set to watch so that we may see its current state).

You can also Delete All Watches , removing the Watch notation from all variables from the Debug menu.

Blueprint Debugger Tab
You can also debug your Blueprints through the Blueprint Debugger which you can open from the Window / Developer Tools section.

When you are not playing in the editor, the Blueprint Debugger displays any Watched variables or Breakpoints assigned (yellow box below).

You can add multiple Blueprints to the Blueprint Debugger tab, by holding Shift and clicking on Actors in your scene.
When you play (or simulate) in the editor, the lower section of the debugger becomes populated, this section is the Execution Trace .

This is a log of all executed commands in the order in which they were issued (with the top being most recent).
When hitting a Breakpoint, the Debugging Controls mentioned on this page, can be accessed directly inside the Blueprint Debugger tab.
Compile Errors
There could any number of reasons as to why you may see a
Compile Error
(yellow box below) when trying to compile your Blueprint.

In the event that this does occur, if you try to play your game, you will see a message similar to below.

The Blueprint that has the error will also be reflected in the Level Editor viewport as well.

In this instance, you may not be able to successfully use the debugging methods to determine what is occurring. Inside the Blueprint that you compiled that is giving you the error, the nodes that are causing the error will be denoted for you to help identify where the issue is occurring.

You can however refer to the Compiler Results window for additional information as to why you are having an error.

The Compiler Results window should pop up automatically when you encounter an error. You can click on the magnifying class to jump to the location of the error and the node in question. To help solve the issue, a text description of the error is also displayed.


