Choose your operating system:
Windows
macOS
Linux
During development, it's a good idea to take a look at what exactly Unreal Engine is sending to the platform's shader compiler. The information contained in this page will enable you to debug any issues associated with it.
Enabling Dumping of Intermediate Shaders
To start debugging with your engine installation, you'll have to enable some predefined console variables in your
ConsoleVariables.ini
configuration file found in the
Engine/Config
folder. Under the
[Startup]
section, you'll find the following list of console variables, which should look like this:
[Startup]

; Uncomment to get detailed logs on shader compiles and the opportunity to retry on errors
r.ShaderDevelopmentMode=1
; Uncomment to dump shaders in the Saved folder
; Warning: leaving this on for a while will fill your hard drive with many small files and folders
r.DumpShaderDebugInfo=1
; When this is enabled, SCW crashes will print out the list of jobs in the current worker
r.ShaderCompiler.DumpQueuedJobs=1
; When this is enabled, when dumping shaders an additional file to use with ShaderCompilerWorker -direct mode will be generated
r.DumpShaderDebugWorkerCommandLine=1
; When this is enabled, shader compiler warnings are emitted to the log for all shaders as they are loaded (either from the DDC or from a shader compilation job).
r.ShaderCompiler.EmitWarningsOnLoad=1
Remove the ; (semi-colon) next each console variable to enable its usage, and so that it looks like the example code above.
Building ShaderCompileWorker in Debug Mode
By default, UnrealBuildTool (UBT) generates projects for tools, they always compile in Development mode. For the purposes of debugging, you'll want to build the engine and projects in Debug mode, which contains symbols for debugging your project's code.
To build your project in Debug mode, perform the following actions:

-
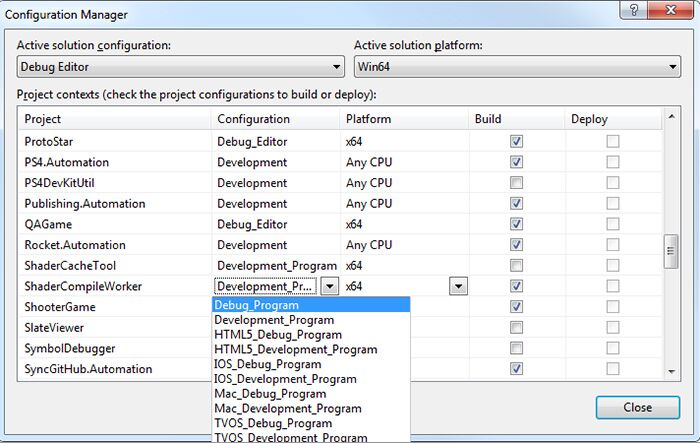
Change your solution properties in Visual Studio using the Configuration Manager , which can be opened from the Build menu.
-
Set the ShaderCompileWorker (SCW) dropdown to Debug_Program .
For additional information about these targets, see the Build Configuration Reference page.
Generating Intermediate Files
In order to debug your shaders, you'll first need to generate the files you want to actually debug. This requires enabling the console variables for dumping intermediate shaders to allow subsequent compilations to dump out generated files.
See the Enabling Dumping of Intermediate Shaders section of this page to see how to enable the appropriate console variables.
Force a rebuild of all shaders by adding a space, or making any inconsequential change, to the
Common.usf
file located in the
Engine/Shaders
folder. Then re-run the editor. This action will trigger a recompile of all shaders and dump all the intermediate files in your project's
Saved/ShaderDebugInfo
folder.
If you are debugging a particular Material, you can make any change, or an inconsequential change, such as moving a node to trigger a change. Use the toolbar to Save or Apply the changes to the Material to dump the shader files again.
Folder Structure of Dumped Shaders
The folder path generated by the dumped shader includes relevant information. Let's look at an example of a dumped shader's path and analyze its parts:
D:\UE4\Samples\Games\TappyChicken\Saved\ShaderDebugInfo\PCD3D_SM5\M_Egg\LocalVF\BPPSFNoLMPolicy\BasePassPixelShader.usf
The first part is the root path to your project. In this case, that's to a project named Tappy Chicken.
D:\UE4\Samples\Games\TappyChicken\
The next part of the path is where our dumped shaders are saved.
D:\UE4\Samples\Games\TappyChicken\ Saved\ShaderDebugInfo \
For every shader format and/or platform, a subfolder is created. This path creates one for PC D3D Shader Model 5 .
D:\UE4\Samples\Games\TappyChicken\Saved\ShaderDebugInfo\ PCD3D_SM5 \
A folder per material, and a special one called Global , is created. The debug shader being looked at here is for the M_Egg Material.
D:\UE4\Samples\Games\TappyChicken\Saved\ShaderDebugInfo\PCD3D_SM5\ M_Egg \
Shaders are grouped in maps ordered by vertex factories, which mostly end up corresponding to a mesh/component type. This path points to a LocalVF , which stands for Local Vertex Factory .
D:\UE4\Samples\Games\TappyChicken\Saved\ShaderDebugInfo\PCD3D_SM5\M_Egg\ LocalVF \
The final part of the path is the permutation of features used for the Material.
D:\UE4\Samples\Games\TappyChicken\Saved\ShaderDebugInfo\PCD3D_SM5\M_Egg\LocalVF\ BPPSFNoLMPolicy \
Because the console variable r.DumpShaderDebugShortNames=1 is set in the ConsoleVariables.ini file, the names are compacted to reduce file length.
For example, if the console variable were not enabled, the path would be:
D:\UE4\Samples\Games\TappyChicken\Saved\ShaderDebugInfo\PCD3D_SM5\M_Egg\FLocalVertexFactory\TBasePassPSFNoLightMapPolicy\
The shader dump folder contains a generated batch file, a text file, and the usf file.
-
The usf file is the final shader code that goes to the platform's compiler, which is run after the pre-processor.
-
The batch file is used to call the platform compiler to look at the intermediate code.
-
The text file, named DirectCompile.txt , contains the command line for debugging with ShaderCompileWorker.
Using ShaderCompileWorker for Debugging
ShaderCompileWorker is able to debug the call to the platform compiler using the following command line:
PathToGeneratedUsfFile -directcompile -format=ShaderFormat -ShaderType -entry=EntryPoint {plus platform specific switches}-
PathToGeneratedUsfFile is the final usf file from the ShaderDebugInfo folder.
-
ShaderFormat is the shader platform format you want to debug (in our case PCD3D_SM5).
-
ShaderType can be vs/ps/gs/hs/ds/cs, which each correspond to one of the shader types below:
Shortened Folder Name
Shader Type
vs
Vertex Shader
ps
Pixel Shader
gs
Geometry Shader
hs
Hull Shader
ds
Domain Shader
cs
Computer Shader
-
EntryPoint is the function name of the entry point for this shader in the usf file.
For example:
D:\UE4\Samples\Games\TappyChicken\Saved\ShaderDebugInfo\PCD3D_SM5\M_Egg\LocalVF\BPPSFNoLMPolicy\BasePassPixelShader.usf -format =PCD3D_SM5 -ps -entry =Main
If you add a breakpoint into the
CompileD3D11Shader()
function on
D3D11ShaderCompiler.cpp
, run SCW with this command line to step into how the engine calls the platform compiler.
This command line can be directly copied if you enabled the console variable r.DumpShaderDebugWorkerCommandLine=1 in the ConsoleVariables.ini file, which dumps a file called DirectCompile.txt next to the generated usf file.