Choose your operating system:
Windows
macOS
Linux
If you are CPU bound in the render thread, it is likely because of too many draw calls. This is a common problem and artists often have to combine draw calls to reduce the cost for that (e.g. combine multiple walls into one mesh). The actual cost is in many areas:
-
The render thread needs to process each object (culling, material setup, lighting setup, collision, update cost, etc.). More complex materials result in a higher setup cost.
-
The render thread needs to prepare the GPU commands to set up the state for each draw call (constant buffers, textures, instance properties, shaders) and to do the actual API call. Base pass draw calls are usually more costly than depth only draw calls.
-
DirectX validates some data and passes the information to the graphics card driver.
-
The driver (e.g. NVIDIA, AMD, Intel, ...) validates further and creates a command buffer for the hardware. Sometimes this part is split in another thread.
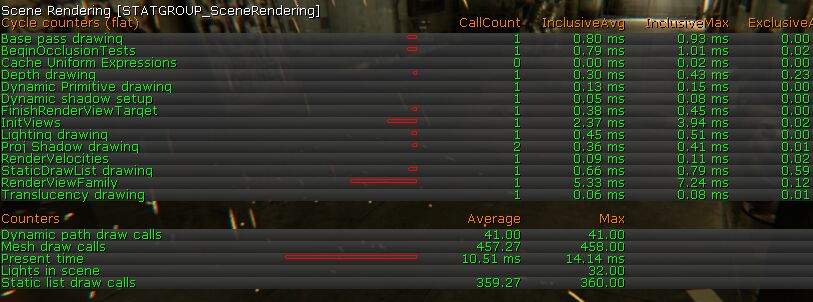
Mesh Draw Calls displayed when using the stats commands show the draw calls caused by 3D meshes - this is the number artists can reduce by:
-
Reducing object count (static/dynamic meshes, mesh particles)
-
Reducing view distance (e.g. on the Scene Capture Actor or per object)
-
Adjusting the view (more zoomed out view, moving objects to not be in the same view)
-
Avoiding SceneCaptureActor (needs to re-render the scene, set fps to be low or update only when needed)
-
Avoiding split screen (Always more CPU bound than single view, needs custom scalability settings or content to be more aggressive)
-
Reducing Elements per draw calls (combine materials accepting more complex pixel shaders or simply have less materials, combine textures to fewer larger textures - only if that reduces material count, use LOD models with fewer elements)
-
Disabling features on the mesh like custom depth or shadow casting
-
Changing light sources to not shadow cast or having a tighter bounding volume (view cone, attenuation radius)
In some cases, hardware instancing might be an option (same 3d model, same shader, only few parameters change, hardware needs to support it). Hardware instancing reduces the driver overhead per draw call a lot but it limits the flexibility. We use it for mesh particles and for InstancedFoliage.
|
|
|---|
|
CONSOLE: stat SceneRendering |
Experience shows that on a high end PC, you can have thousands of draw calls per frame (DirectX11, OpenGL). Newer APIs (AMD Mantle, DirectX12) try to address the driver overhead and can do larger numbers. On mobile, the number is more in the hundreds (OpenGL ES2, OpenGL ES3) but even there the driver overhead can be greatly reduced (Apple Metal).
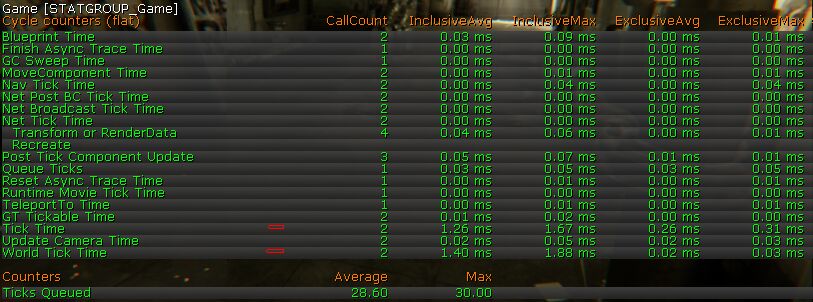
If you are CPU bound in the game thread, you need to look into what game code is causing this issue (e.g. Blueprints, raycasts, physics, artificial intelligence, memory allocation).
|
|
|---|
|
CONSOLE: stat Game |
The build in CPU profiler can help you to find the functions causing the issue:
|
|
|---|
|
CONSOLE: stat DumpFrame -ms=0.1 |
Here we used a threshold of 0.1 milliseconds to customize the output. After running the command, you can find the result in the log and in the console. The hierarchy shows the time in milliseconds and the call count. If needed, you can add QUICK_SCOPE_CYCLE_COUNTER to the code to refine the hierarchy further like the following example:
virtual void DrawDynamicElements(FPrimitiveDrawInterface* PDI,const FSceneView* View) override
{
    QUICK_SCOPE_CYCLE_COUNTER( STAT_BoxSceneProxy_DrawDynamicElements );

    const FMatrix& LocalToWorld = GetLocalToWorld();
    const FColor DrawColor = GetSelectionColor(BoxColor, IsSelected(), IsHovered(), false);
    DrawOrientedWireBox(PDI, LocalToWorld.GetOrigin(), ... );
}
If you are not CPU bound, then you are GPU bound .


