Choose your operating system:
Windows
macOS
Linux
The GPU has many units working in parallel and it is common to be bound by different units for different parts of the frame. Because of this, it makes sense to look at finding where the GPU cost is going when looking for the bottleneck and what a GPU bottleneck is.
Where is the GPU Cost Going
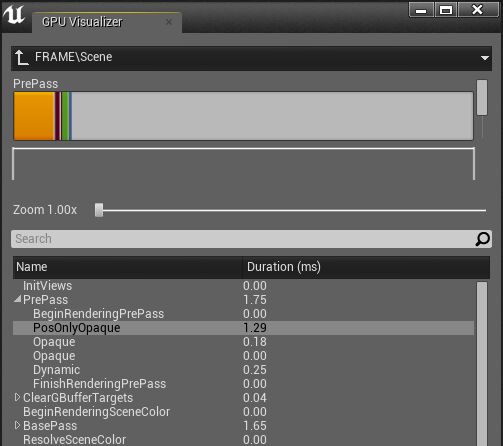
The ProfileGPU command allows you to quickly identify the GPU cost of the various passes, sometimes down to the draw calls. You can either use the mouse based UI or the text version. You can suppress the UI with r.ProfileGPU.ShowUI . The data is based on GPU timestamps and is usually quite accurate. Certain optimizations can make the numbers less reliable and it is good to be critical about any number. We found that some drivers tend to optimize shader cost a few seconds after using the shader. This can be noticeable and it might be useful to wait a bit or measure another time to get more confidence.
|
|
|---|
|
CONSOLE: ProfileGPU |
|
Shortcut: Ctrl+Shift+, |
...
 1.2% 0.13ms   ClearTranslucentVolumeLighting 1 draws 128 prims 256 verts
42.4% 4.68ms   Lights 0 draws 0 prims 0 verts
   42.4% 4.68ms   DirectLighting 0 draws 0 prims 0 verts
       0.8% 0.09ms   NonShadowedLights 0 draws 0 prims 0 verts
          0.7% 0.08ms   StandardDeferredLighting 3 draws 0 prims 0 verts
          0.1% 0.01ms   InjectNonShadowedTranslucentLighting 6 draws 120 prims 240 verts
      12.3% 1.36ms   RenderTestMap.DirectionalLightImmovable_1 1 draws 0 prims 0 verts
          1.4% 0.15ms   TranslucencyShadowMapGeneration 0 draws 0 prims 0 verts
...
ProfileGPU shows the light name which makes it easier for the artist to optimize the right light source.
It makes sense to look at the high level cost in each frame and get a feel for what is reasonable (e.g. draw call heavy, complex materials, dense triangle meshes, far view distance):
-
EarlyZPass: By default we use a partial z pass. DBuffer decals require a full Z Pass. This can be customized with r.EarlyZPass and r.EarlyZPassMovable .
-
Base Pass: When using deferred, simple materials can be bandwidth bound. Actual vertex and pixel shader is defined in the material graph. There is an additional cost for indirect lighting on dynamic objects.
-
Shadow map rendering: Actual vertex and pixel shader is defined in the material graph. The pixel shader is only used for masked or translucent materials.
-
Shadow projection/filtering: Adjust the shader cost with r.ShadowQuality.Disable shadow casting on most lights. Consider static or stationary lights.
-
Occlusion culling: HZB occlusion has a high constant cost but a smaller per object cost. Toggle r.HZBOcclusion to see if you do better without it on.
-
Deferred lighting: This scales with the pixels touched, and is more expensive with light functions, IES profiles, shadow receiving, area lights, and complex shading models.
-
Tiled deferred lighting: Toggle r.TiledDeferredShading to disable GPU lights, or use r.TiledDeferredShading.MinimumCount to define when to use the tiled method or the non-deferred method.
-
Environment reflections: Toggle r.NoTiledReflections to use the non-tiled method which is usually slower unless you have very few probes.
-
Ambient occlusion: Quality can be adjusted, and you can use multiple passes for efficient large effects.
-
Post processing: Some passes are shared, so toggle show flags to see if the effect is worth the performance.
Some passes can have an effect on the passes following after them. Some examples include:
-
A full EarlyZ pass costs more draw calls and some GPU cost but it avoids pixel processing in the Base Pass and can greatly reduce the cost there.
-
Optimizing the HZB could cause the culling to be more conservative.
-
Enabled shadows can reduce the lighting cost of the light if large parts of the screen are in shadow.
What is the GPU Bottleneck?
Often, the performance cost scales with the amount of pixels. To test that, you can vary the render resolution using r.SetRes or scale the viewport in the editor. Using r.ScreenPercentage is even more convenient but keep in mind there is some extra upsampling cost added once the feature gets used.
If you see a measurable performance change, you are bound by something pixel related. Usually, it is either memory bandwidth (reading and writing) or math bound (ALU), but in rare cases, some specific units are saturated (e.g. MRT export). If you can lower memory (or math) on the relevant passes and see a performance difference, you know it was bound by the memory bandwidth (or the ALU units). The change does not have to look the same - this is just a test. Now you know you have to reduce the cost there to improve the performance.
The shadow map resolution does not scale with the screen resolution (use r.Shadow.MaxResolution ), but unless you have very large areas of shadow casting masked or translucent materials, you are not pixel shader bound. Often the shadow map rendering is bound by vertex processing or triangle processing (causes: dense meshes, no LOD, tessellation, WorldPositionOffset use). Shadow map rendering cost scales with the number of lights, number of cascades/cubemaps sides and the number of shadow casting objects in the light frustum. This is a very common bottleneck and only larger content changes can reduce the cost.
Highly tessellated meshes, where the wireframe appears as a solid color, can suffer from poor quad utilization. This is because GPUs process triangles in 2x2 pixel blocks and reject pixels outside of the triangle a bit later. This is needed for mip map computations. For larger triangles, this is not a problem, but if triangles are small or very lengthy the performance can suffer as many pixels are processed but few actually contribute to the image. Deferred shading improves the situation, since we get very good quad utilization on the lighting. The problem will remain during the base pass, so complex materials might render quite a bit slower. The solution to this is using less dense meshes. With level of detail meshes this can be done only where it is a problem (in the distance).
You can adjust r.EarlyZPass to see if your scene would benefit from a full early Z pass (more draw calls, less overdraw during base pass).
If changing the resolution does not matter much, you are likely bound by vertex processing (vertex shader, or tessellation) cost. Often, you will have to change content to verify that. Typical causes include:
-
Too many vertices. (Use Level of Detail meshes)
-
Complex World Position Offset / Displacement Material using Textures with poor MIP mapping. (adjust the Material)
-
Tessellation (Avoid if possible, adjust tessellation factor - fastest way: show Tessellation, some hardware scales badly with larger tessellation levels)
-
Many UV or Normal seams result in more vertices. (look at unwrapped UV - many islands are bad, flat shaded meshes have 3 vertices per triangle)
-
Too many vertex attributes. (extra UV channels)
-
Verify the vertex count is reasonable, some importer code might not have welded the vertices. (combine vertices that have same position, UV and normal)
Less often, you are bound by something else. That could be:
-
Object cost (more likely a CPU e.g. cost but there might be some GPU cost)
-
Triangle setup cost (very high poly meshes with a cheap vertex shader e.g. shadow map static meshes, rarely the issue)
-
Use level of detail (LOD) meshes
-
View cost (e.g. HZB occlusion culling)
-
Scene cost (e.g. GPU particle simulation)
Live GPU Profiler
The live GPU profiler provides real-time per-frame stats for the major rendering categories. To use the live GPU profiler, press the Backtick key to open the console and then input stat GPU and press Enter . You can also bring the live GPU profiler up via the Stat submenu in the Viewport Options dropdown.

The stats are cumulative and non-hierarchical, so you can see the major categories without having to dig down through a tree of events. For example, Shadow Projection is the sum of all the shadow projections for all lights across all the views. The on-screen GPU stats provide a simple visual breakdown of the GPU load when your title is running. They are also useful to measure the impact of changes instantaneously; for example when changing console variables, modifying materials in the editor or modifying and re-compiling shaders on the fly (with recompileshaders changed). The GPU stats can be recorded to a file when the title is running for analysis later.
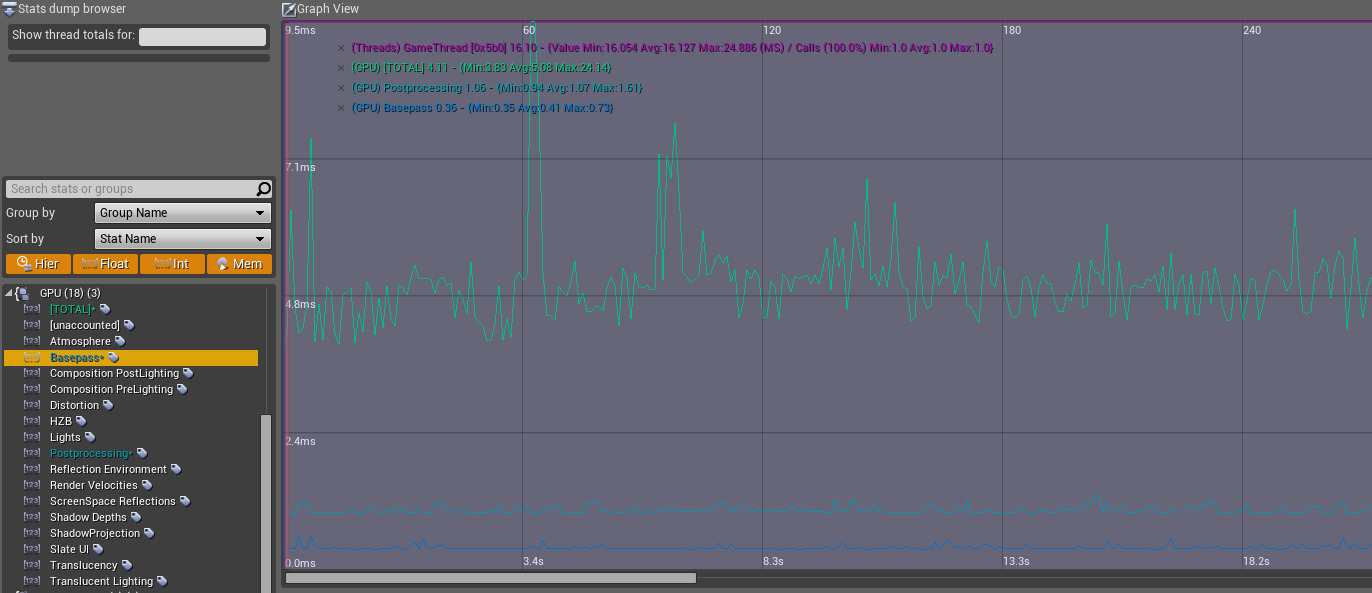
As with existing stats, you can use the console commands stat startfile and stat stopfile to record the stats to a ue4stats file, and then visualize them by opening the file in the Unreal Frontend tool .

Profiling the GPU with UnrealFrontend. Total, postprocessing and basepass times are shown.
Stats are declared in code as float counters, e.g:
DECLARE_FLOAT_COUNTER_STAT(TEXT("Postprocessing"), Stat_GPU_Postprocessing, STATGROUP_GPU);Code blocks on the rendering thread can then be instrumented with SCOPED_GPU_STAT macros which reference those stat names. These work similarly to SCOPED_DRAW_EVENT. For example:
SCOPED_GPU_STAT(RHICmdList, Stat_GPU_Postprocessing);GPU work that isn�t explicitly instrumented will be included in a catch-all [unaccounted] stat. If that gets too high, it indicates that some additional SCOPED_GPU_STAT events are needed to account for the missing work. It�s worth noting that unlike the draw events, GPU stats are cumulative. You can add multiple entries for the same stat, and these are aggregated across the frame. Certain CPU-bound cases the GPU timings can be affected by CPU bottlenecks (bubbles) where the GPU is waiting for the CPU to catch up, so please consider that if you see unexpected results in cases where draw thread time is high. On PlayStation 4 we correct those bubbles by excluding the time between command list submissions from the timings. In future releases, we will be extending that functionality to other modern rendering APIs.
