Choose your operating system:
Windows
macOS
Linux
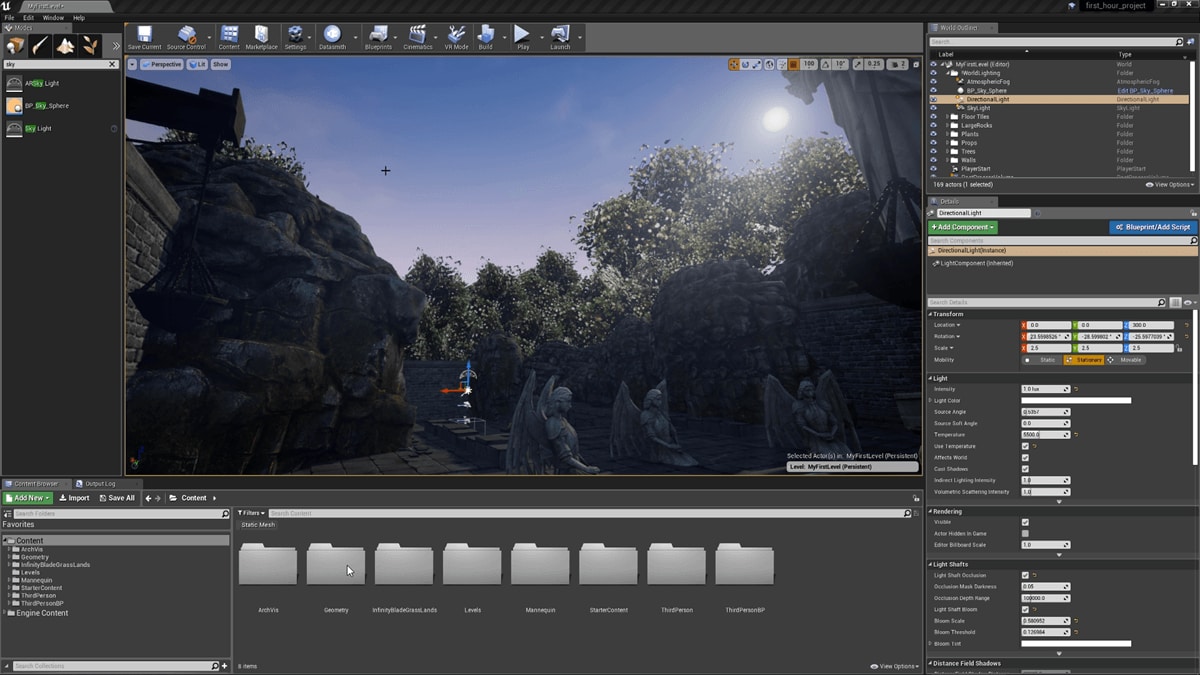


At the top of the Level Editor window, at the right side of the Tab Bar, you will find a series of performance and debugging tools.
From left to right, they are:

|
Number |
Name |
Description |
|---|---|---|
|
1 |
Console Command Bar |
This text field is used to input console commands within the editor. |
|
2 |
Source Control Status |
This shows the current status of the integrated Perforce server. |
|
3 |
Performance Data |
This region displays the following information:
|
|
4 |
20 Second Playback |
This saves a 20-second video of the last 20 seconds of work. A bar will appear at the bottom of the Level Editor showing the path to the video.
|
