Choose your operating system:
Windows
macOS
Linux
In order to understand and use the content on this page, make sure you are familiar with the following topics:
While developing the user-interface (UI) for applications, UI developers sometimes need to debug Slate, which is where the Console Slate Debugger can help. Console Slate Debugger hooks into the available systems in FSlateDebugging to print internal Slate data. Additionally, as the UI focus changes (or attempts to change), developers will need to know what system is handling those focus updates.

Console Slate Debugger
In 4.26, extensions for Console Slate Debugger now include the following:
-
GlobalInvalidation, which helps to identify the widgets responsible for a costly frame.
-
A paint option that displays widgets that were painted in a given frame.
-
An additional routing option to see how the system chooses a widget as the event handler.
-
Additional filter and event console commands.
SlateDebugger
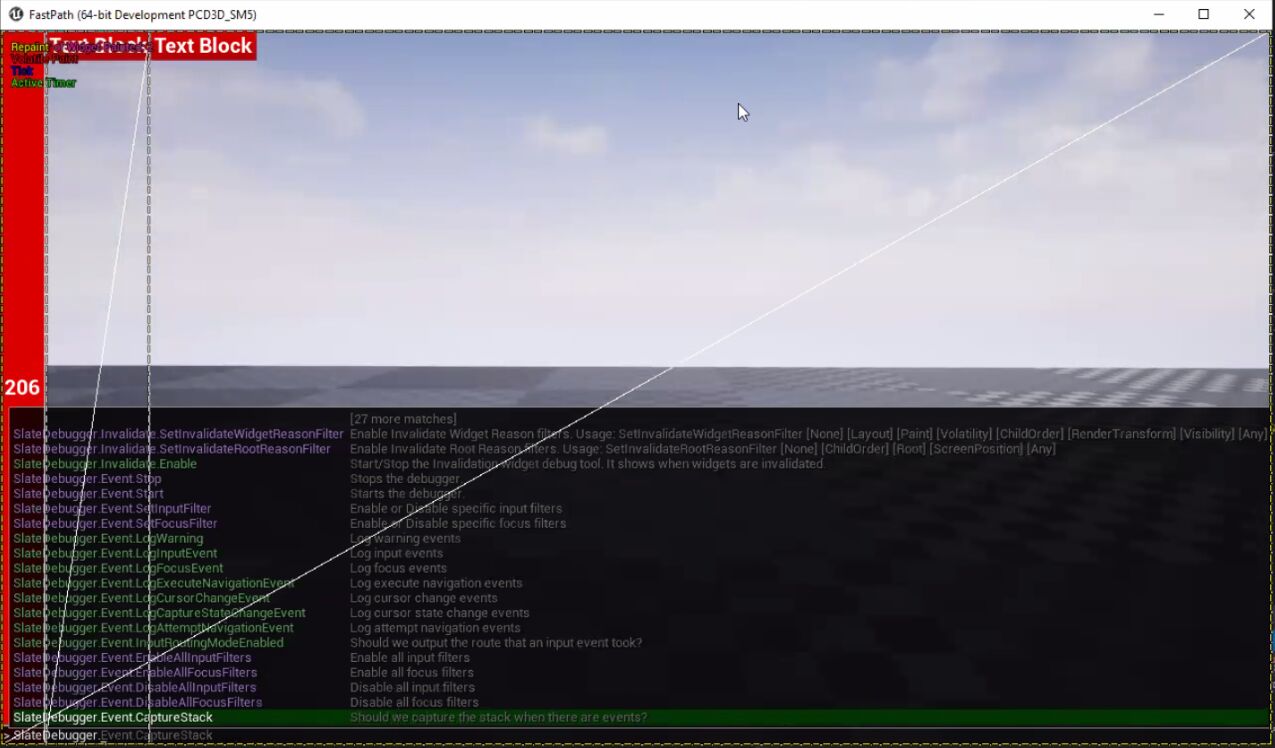
While running the project in PIE mode, press the tilde (~) key to open the PIE Console, and type
SlateDebugger
.

SlateDebugger logs are typically written to a
[ProjectName].txt
log file under
[ProjectName]/Saved/Logs
.
Event Commands
Slate Debugger offers a lot of different commands to pinpoint specific information like enabling or disabling specific logs and filtering events. If more information is needed CaptureStack can also provide the call stack of the triggered event.
|
SlateDebugger.Event |
Command Description |
|---|---|
|
Start |
Alias for
|
|
Stop |
Alias for
|
|
SetInputFilter |
Enables or disables specific input filters. |
|
SetFocusFilter |
Enables or disables specific focus filters. |
|
LogWarning |
Logs warning events. |
|
LogInputEvent |
Logs input events. |
|
LogFocusEvent |
Logs focus events. |
|
LogExecuteNavigationEvent |
Logs execute navigation events. |
|
LogCaptureStateChangeEvent |
Logs cursor state change events. |
|
LogCursorChangeEvent |
Logs cursosr change events. |
|
LogAttemptNavigationEvent |
Logs attempt navigation events. |
|
InputRoutingModeEnabled |
If enabled, outputs the route taken by an input event. |
|
EnableAllInputFilters |
Enables all input filters. |
|
DisableAllInputFilters |
Disables all input filters. |
|
EnableAllFocusFilters |
Enables all focus filters. |
|
DisableAllFocusFilters |
Disables all focus filters. |
|
CaptureStack |
If enabled, captures the stack when there are events. |
Invalidate Commands
These commands allow you to use the Invalidate command to show on-screen widgets that are invalidated. Each invalidated widget will be highlighted in different colors based on the type of invalidation.

SlateDebugger.Invalidate
|
SlateDebugger.Invalidate |
Command Description |
|---|---|
|
Enable |
Starts the Invalidation Widget debug tool and display when widgets invalidate or stop the Invalidation Widget debug tool, depending on the current status. |
|
Start |
Starts the Invalidation Widget debug tool and displays when widgets invalidate. |
|
Stop |
Stops the Invalidation Widget debug tool. |
|
SetInvalidateRootReasonFilter |
|
|
SetInvalidateWidgetReasonFilter |
|
|
ToggleLegend |
Displays the color legend. |
|
ToggleLogInvalidateWidget |
Logs the invalidated widget to the console. |
|
ToggleWidgetNameList |
Displays the name of the invalidated widget. |
Paint Commands
This command is used to highlight widgets that are painted in each frame. This can be useful to identify widgets that are painted even if they did not change. Note that volatile widgets are painted every frame.

SlateDebugger.Paint
|
SlateDebugger.Paint |
Command Description |
|---|---|
|
Enable |
Starts the Paint Widget debug tool and display when widgets paint or stop the Paint Widget debug tool, depending on the current status. |
|
Start |
Starts the Paint Widget debug tool and displays when widgets paint. |
|
Stop |
Stops the Paint Widget debug tool. |
|
LogOnce |
Logs the widgets that paint once during the last update |
|
LogWarningIfWidgetIsPaintedMoreThanOnce |
Logs a warning if a widget paints more than once in the same frame. |
|
MaxNumberOfWidgetDisplayedInList |
Displays the maximum number of widgets that will display when
|
|
ToggleWidgetNameList |
Displays painted widget names. |
Update Commands
This command is used to highlight widgets that are updated more often than needed. Since Widget Update can be overridden or executed in Blueprint, it is a common source of poor performance if the widget code was not designed correctly.

SlateDebugger.Update
|
SlateDebugger.Update |
Command Description |
|---|---|
|
Enable |
Starts the Update Widget debug tool and displays when widgets update, or stops the Update Widget debug tool, depending on the current status. |
|
Start |
Starts the Update Widget debug tool and display when widgets update. |
|
Stop |
Stops the Update Widget debug tool. |
|
SetInvalidationRootIdFilter |
Only display widgets that are part of an invalidation root. |
|
SetWidgetUpdateFlagsFilter |
|
|
ToggleLegend |
Displays the color legend. |
|
ToggleUpdateFromPaint |
Displays widgets that do not have an update flag but which are still updated as a side effect of another widget. |
|
ToggleWidgetNameList |
Displays the names of Update Widgets. |