Choose your operating system:
Windows
macOS
Linux
Niagara Debugger
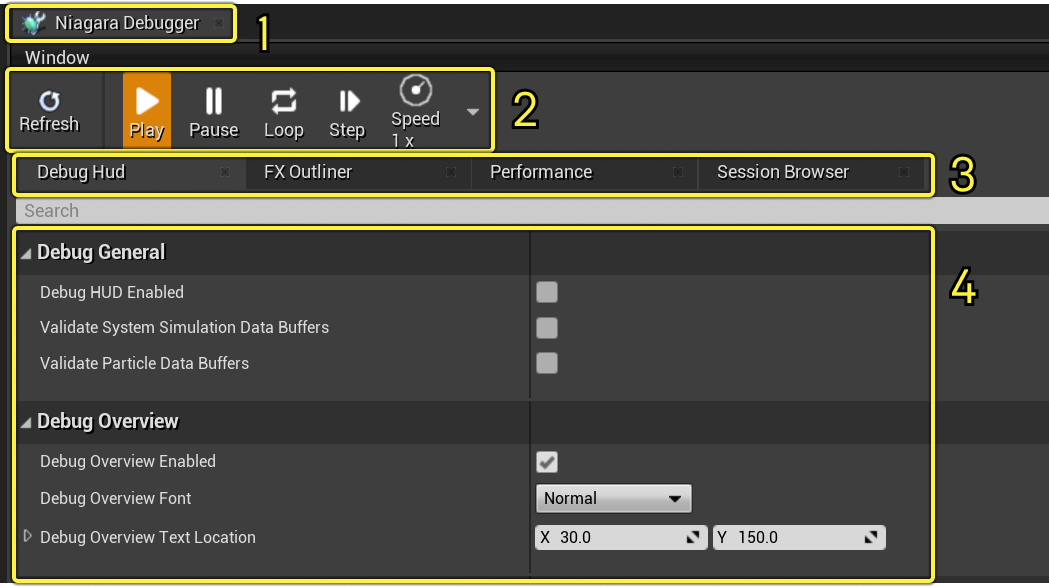
The Niagara Debugger gives you a suite of tools to help you review detailed data about the simulations currently in your level. In order to turn on the Debugger, from within your level click the top menu and select Window > Niagara Debugger . This displays a panel that you can dock where you prefer.
-
Niagara Debugger Panel
-
Playback Options
-
Debugger Tabs
-
Debugger Options
The Debugger is broken up into several sections. First, there is a top section that provides you with playback controls. Here you can select Play, Pause, Loop, Step, and Speed.

|
Parameter |
Description |
|---|---|
|
Refresh |
Refresh the settings on the selected device. Use this when something gets out of sync. |
|
Play |
Play all Niagara simulations in the level. |
|
Pause |
Pause all Niagara simulations in the level. |
|
Loop |
Loop all Niagara simulations in the level. When paired with the Loop Time settings, single-fire systems like bursts can be made to loop. |
|
Step |
Step forward all Niagara simulations by one single frame per click. |
|
Speed |
Adjust the speed of Niagara simulations in the level. This only affects the playback speed of Niagara simulations, any other elements in your level will play back at normal speed. |
Underneath the playback controls, you will see different tabs. Clicking a tab gives you access to the different tools within the Debugger.

|
Parameter |
Description |
|---|---|
|
Debug HUD |
Debug Hud lets you turn on a heads-up display to view detailed information about the simulations in your level. |
|
FX Outliner |
The FX Outliner gives you debugging and profiling data on Niagara as it runs on a device or in PIE. |
|
Performance |
Use various performance testing tools to analyze your Niagara simulations. |
|
Session Browser |
Set the Debugging options to a different session, for example to a console, or PIE. |
Debug HUD
The first tab in the Debugger is the Debug HUD tab. You can turn on the Debug HUD to show a heads-up display directly in the Viewport of your level. You can then choose what information to display by adjusting the options.
To turn on the Debug HUD, select the Debug HUD Enabled option from the Debug HUD tab.

Once the Debug HUD is enabled, you will see a printout of various values in the Viewport .

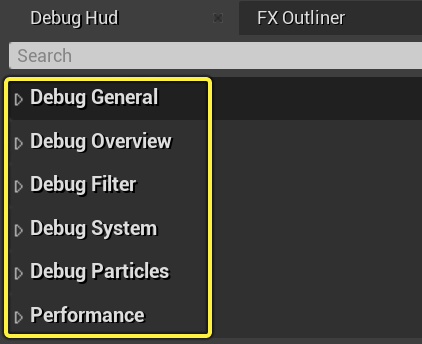
The settings that you select in the Debug HUD tab will be saved between sessions. You can choose to display a variety of data. This data is broken up into several groups.
|
Parameter |
Description |
|---|---|
|
Debug Overview |
This section lets you turn on an overview section at the top of the Debug HUD that includes the total number of systems, total scalability, total number of active emitters, total number of particles, and total memory. |
|
Debug Filters |
This section lets you set filters so that you only display information about actors, components, systems, or emitters that match that filter. For example, you can type in
For more information, see Wildcard Searching . |
|
Debug System |
This section displays detailed information for each system in the Viewport of the Level Editor. |
|
Debug Particles |
This section lets you show detailed information on individual particles in the Viewport. Given that you may have thousands of particles, you can also limit the amount of data displayed to a maximum number of particles. |
Debug Overview
Click Debug Overview Enabled to turn on the display of these values in the Viewport .

This shows a printout of the following information in the Viewport :
-
Total number of systems
-
Total scalability
-
Total number of active emitters
-
Total number of particles
-
Total memory

Clicking the Overview Font option will let you choose whether you want to view the Small or Normal sized font. You can also adjust the position of the overview in the Viewport using the Overview Location values.
Debug Filters
The filters that you have active help you to control what information you see printed out in the Debug HUD. By default, each of these filters is set to (*), meaning show everything.
You can click the checkbox next to any of the filters to enable it. You can choose to filter out Actors , Components , Systems , or Emitters .
To set a filter, type in what you would like to filter between asterisks. For example, if you want to filter out Systems with the word System in the name, click on the checkbox next to
System Filter
to enable it and then type in
*System*
into the text entry field.

In the Debug HUD you will then see the systems matching the filter highlighted in yellow.
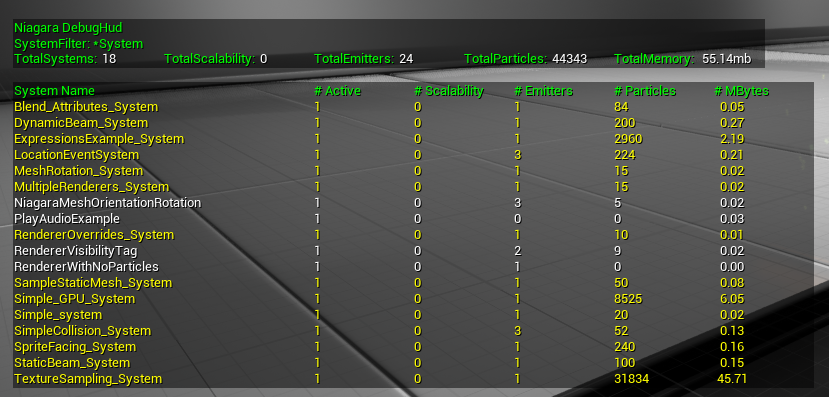
For more information, see Wildcard Searching .
Debug System
You can enable a display of debug information for each system in the Viewport using this section.
This information will only be displayed if at least one filter is enabled and at least one system passes the filter.
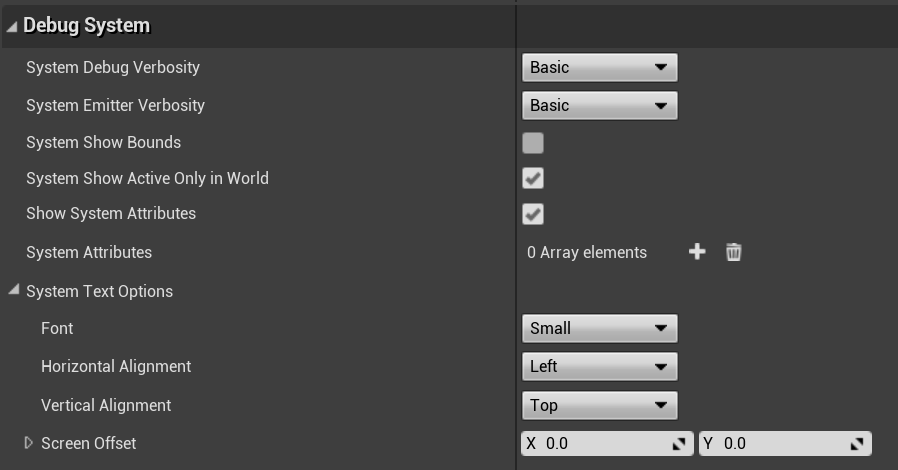
Set the following options to adjust the display of system information in the Viewport.
|
Parameter |
Description |
|---|---|
|
System Debug Verbosity |
None - displays only the system's bounds (if enabled) and the location and orientation of the system Basic - displays the system's bounds (if enabled), the location and orientation of the system, and the component and system name. Also displays if a system is culled out by scalability and why. Verbose - displays the system's bounds (if enabled), the location and orientation of the system, the component and system name. Displays if a system is culled out by scalability and why. Shows the system's active state. Displays the amount of memory that system is using. Shows if the system has an Effect Type . |
|
System Emitter Verbosity |
None - no additional information is displayed. Basic - displays the number of emitters and particles. Verbose - shows each emitter found in the system, the state of that emitter, and the number of particles owned by it. |
|
System Show Bounds |
Displays the system bounds. If the system has fixed bounds, this size will be constant. If the bounds are not fixed, the bounds will dynamically resize to encompass the system's particles. |
|
System Show Active Only in World |
When this option is enabled, you will only see information displayed for visible systems. When disabled, you will see a display of systems that have been culled by scalability. Culled systems are represented by a black locator. |
|
Show System Attributes |
As long as the System Debug Verbosity is set to Basic or Verbose, you can use System Attributes to display additional information in the Debug HUD. For example, you can add an array of one or more specific attributes such as System.Age. Or you could could use an asterisk to show all attributes containing a word, such as
For more information, see Wildcard Searching . |
|
System Text Options |
Use these options to adjust the display of text with respect to the origin of the system. Font adjusts the size (Small or Normal). Horizontal Alignment : Left, Center, or Right aligned with the system origin. Vertical Alignment : Top, Center, or Bottom aligned with the system origin. Screen Offset : Makes adjustments to the left or right using coordinates. |
System Options are printed in the Viewport next to the origin of each system according to the options set above.

If you choose to enable the option System Show Bounds , it will draw a dynamically-updating box around the bounds of the system.

Debug Particles
Using the Debug HUD you can display per-particle information directly in the viewport to help you debug your scene.
Remember when using Debug Particles that it can be helpful to use the playback controls to Pause , Skip , and Play .

In order for Particle Attributes to be displayed, the System Debug Verbosity must be set to Basic or Verbose .
|
Parameter |
Description |
|---|---|
|
Show Particle Attributes |
Enable this option to show a visual display of attributes per particle. You can then use the array element to add particle attributes to display. Like in the System Attributes, you can use an asterisk to filter a range of attributes using a string or you can type in the exact name of the attribute, for example Color. For more information, see Wildcard Searching . |
|
Enable GPU Readback |
First, you must enable the Show Particle Attributes option. Then, if you enable this option, you will see a display of particle attributes for GPU emitters. When using this option, data is gathered from the GPU and sent back to the CPU for processing so there is a latency of a few frames. There is a memory cost for using this option, since we readback everything for each system. |
|
Particle Attributes |
Enter in attributes into an array to print them out in the Viewport next to the particles. You can enter in more than one attribute, but you must have at least one attribute set in order to have something displayed. Example: In the above screenshot, there are 2 attributes added to the array: Color and Position. |
|
Particle Text Options |
Choose the options here to adjust the display of the text in the viewport. By default, each particle has the text printed next to it individually, and the text will follow the movement of the particle from one frame to the next. Font : Small or Normal. Horizontal Alignment : Left, Center, or Right of the particle. Vertical Alignment : Top, Center, or Bottom of the particle. |
|
Show Particle Attributes With System |
Enabling this option overrides the default behavior of Particle Text Options. Instead of the text being printed next to each particle, the text is appended to the System Stats. |
|
Use Max Particles to Display |
This option determines the number of particles to display information about in the viewport. If Enabled , this shows the number of particles you set in the Max Particles to Display field. If Disabled , this shows all of the visible particles in the level for all Niagara systems. If you have thousands of particles in your level, this could cause performance issues and out-of-memory errors on some workstations. |
|
Show Global Budget Info |
This option shows an additional widget with the global budget information. This displays the global FX time, budget in ms, and the time/budget ratio. |
Once you have set up the options to your liking, you will see a printout per particle in the Viewport with the attributes that you selected in the array for Particle Attributes.

Wildcard Searching
When filtering, sometimes you want to filter or search using an exact string. At other times, you may want to search or filter for all items that contain a string. Use the following guidelines for how to use the asterisk (*) for wildcard searching.
|
Syntax |
Description |
|---|---|
|
mystring |
Return the exact string mystring |
|
*mystring |
Return any item that ends with mystring |
|
mystring* |
Return any item that starts with mystring |
|
*mystring* |
Return any item that contains mystring somewhere in the text, for example WootMyStringIsGreat |
|
my*string |
Return any item that starts with my and ends with string but contains anything in between, for example MyGreatestEverString |
Console Commands
All options present in the Debug HUD tab can be run manually with the console commands.
In order to run console commands, you need to enter them into the Output Log's console.
fx.Niagara.Debug.Hud
The main console commands to modify the HUD, with values you can set, are:
-
fx.Niagara.Debug.Huddisplays the list of available commands. -
Enabled=1will enable the HUD (0 will disable it). -
ValidateSystemSimulationDataBuffers=1enable or disable (0 will disable it) validation on system data buffers. -
bValidateParticleDataBuffers=1enable or disable (0 will disable it) validation on particle data buffers. -
OverviewEnabled=1enable or disable (0 will disable it) the main overview display. -
OverviewLocation=30,50sets the location of the HUD in the Editor Viewport. First value corresponds to the X axis and the second corresponds to the Y axis. -
ShowGlobalBudgetInfo=1enables Global budget information widget (0 will disable it). -
EnableGpuParticleReadback=1will allow us to readback GPU data for particle display (0 will disable it). -
SystemDebugVerbosity=0sets the system verbosity level. 0 corresponds to None, 1 to Basic, and 2 to Verbose. -
SystemEmitterVerbosity=0sets the in world system emitter debug verbosity. 0 corresponds to None, 1 to Basic, and 2 to Verbose. -
SystemShowBounds=1shows all filtered systems bounds (0 will disable it). -
SystemShowActiveOnlyInWorld=1will only show in world display for active components (0 will disable it). -
SystemFilter=*Flop*sets the wildcard system filter for in world display, this would match anything that contains flop in the name. -
ComponentFilter=MyCompwill filter in world display to all components that match MyComp. -
ShowSystemVariables=1enables System variables visibility (0 will disable it). -
SystemVariables=Position,*Colorwould display any variable that matches "Position" and all variables that contain "Color". -
ShowParticlesVariablesWithSystem=1when enabled, particle variables are shown with the system display, when disabled (set to 0), it's attached to the component in world display. -
MaxParticlesToDisplay=32limits the display to 32 particles, this is purely to avoid destroying the frame rate / memory. -
ShowParticleVariables=1enables Particle variables visibility (0 will disable it). -
ParticlesVariables=*Pos,Colorwill display any variable that contains "Pos" and any variable that matches "Color".
fx.Niagara.Debug.PlaybackMode
Sets the playback mode for all Niagara effects.
-
fx.Niagara.Debug.PlaybackMode 0will play all simulations. -
fx.Niagara.Debug.PlaybackMode 1will pause the simulation. -
fx.Niagara.Debug.PlaybackMode 2will step a single frame then pause all simulations.
fx.Niagara.Debug.PlaybackRate
Playback Rate is a modifier to delta time for all Niagara simulations.
-
fx.Niagara.Debug.PlaybackRate 0.5will run all simulations at half speed.
Show Global Budget info related commands
-
fx.budget.enabled 1enables Global Budget tracking (0 will disable it). -
fx.Budget.GameThreaddisplays the Budget (in ms) for all combined FX work that runs only on the gamethread. As this budget is approached or exceeded, various FX systems will attempt to scale down more and more aggressively to remain in budget. -
fx.Budget.GameThreadConcurrentdisplays the Budget (in ms) for all combined FX work that runs on the gamethread or on a concurrent task spawned from the game thread. As this budget is approached or exceeded, various FX systems will attempt to scale down more and more aggressively to remain in budget. -
fx.Budget.RenderThreaddisplays the Budget (in ms) for all combined FX work that runs on the Render Thread. As this budget is approached or exceeded, various FX systems will attempt to scale down more and more aggressively to remain in budget.
FX Outliner
The FX Outliner is the second tab you will find in the Niagara Debugger panel. This tab provides you with the ability to capture data from the Niagara simulations in your level so that you can analyze it.
This feature is still in development and will continue to evolve in future versions.
To open the FX Outliner, click the tab in the Niagara Debugger.

To start, click the Capture button. The FX Outliner will wait the number of frames specified in the Delay field and then start to run. You will then see the output in the section below.

FX Outliner Interface
The FX Outliner interface is laid out as follows.

-
Toolbar
-
World Row
-
System Row
-
System Instance Row
-
Emitter Row
-
Inline Data
-
Details of selected row
The FX Outliner toolbar is where you can select the options for the tool.

|
Parameter |
Description |
|---|---|
|
Capture |
Click to trigger a capture on the currently connected device. To change the device being used, click the Session Browser tab in the Debugging panel. |
|
Perf |
Toggle this button on or off to capture performance data in this capture. |
|
Delay |
Set the number of frames to delay before capturing data. You may want to set a delay for example if you need to perform a specific action in-game. This value also sets the duration of the capture. |
|
View Mode |
Choose which view mode for the capture area below. There are two view modes, State and Performance. State displays the execution state, the number of particles, the number of particles, and whether the sim target is the CPU or the GPU. Performance displays performance information when available. Currently performance is gathered at a system and system instance level. Emitters only display state data. |
|
Filters |
Clicking this will let you select various filtering options for the capture data. System Execution State : show only systems that are active / inactive / inactive clear / complete. Emitter Execution State : show only systems that are active / inactive / inactive clear / complete.
Emitter Sim Target can be filtered by CPU or GPU. System Cull State shows only systems that have or have not been culled by scalability.
You can also filter by string using the search box. |
|
Descending |
Toggle Ascending or Descending to change how the entries are sorted based on the value for the Sort Mode . |
|
Sort Mode |
Sets how the entries are sorted. Auto chooses the default mode for the current view mode. If you are in State View, this will sort by the number of entries that match the current filters. In Performance View, it will sort by the Average Game Thread Time. Filter Matches will sort by the number of entries that match the filter criteria. Average Time will sort by the average game thread time. Max Time will sort by the maximum game thread time. |
|
Units |
View time values in performance mode in microseconds, milliseconds, or seconds. The default value is microseconds. |
State View
The state view displays data on the state of the line item. Depending on whether that line represents a World, System, System Instance, or Emitter, the type of data that will be displayed is different.

-
World
-
System
-
System Instance
-
Emitter
Worlds
|
Parameter |
Description |
|---|---|
|
World Type |
Shows the data source. Examples: Editor, Game, PIE. |
|
Net Mode |
Shows whether this is a client, a dedicated server, or standalone. |
|
Has Begun Play |
Returns True or False. |
|
Number of Systems |
This is the number of systems in the world that match the current search filters. |
Systems
Systems currently only output the number of system instances that match the current search filters.
System Instances
|
Parameter |
Description |
|---|---|
|
Pooling Method |
Returns one of None, InUse, or FreeInPool. |
|
Execution State |
Shows whether the system as a whole is Active, Inactive, or Complete. |
|
Number of Emitters |
Shows the number of emitters in this system instance that match the current search filters. |
|
Uninitialized |
If a component is created but has not yet been fully initialized it will display Uninitialized. |
Emitters
|
Parameter |
Description |
|---|---|
|
Execution State |
This shows the emitter's current state, Active, Inactive, or Complete. |
|
Sim Target |
Displays whether this emitter is a CPU or GPU emitter. |
|
Number of Particles |
Shows the number of particles. |
Performance View
Performance View will display any performance data that was captured. The numbers are displayed in the selected units, which defaults to microseconds.
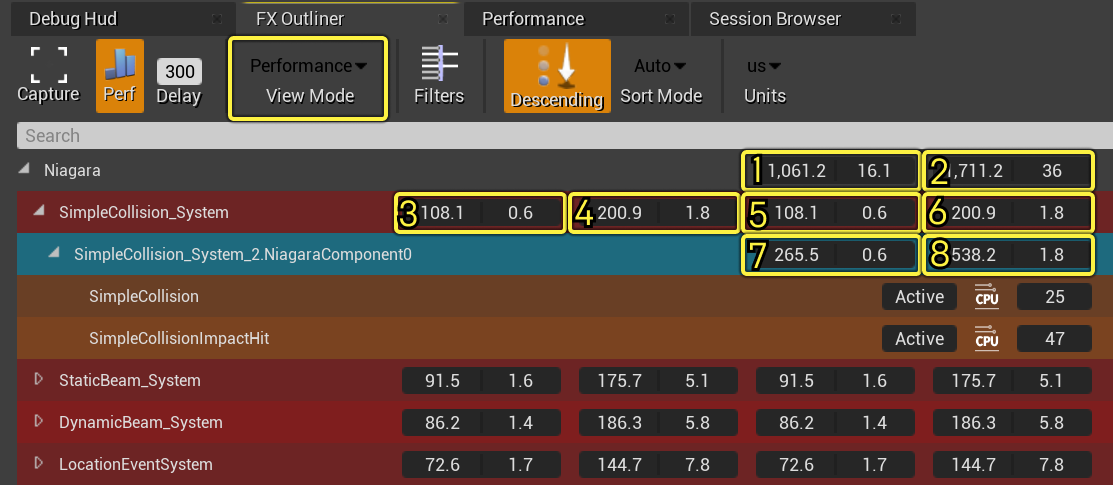
Each block of numbers is split into two. On the left you will see the game thread cost, on the right is the render thread cost.
All values are calculated over the capture time that is set by the Delay value.
-
Average total frame time for all effects.
-
Maximum total frame time for all effects.
-
Average per instance cost for this system.
-
Maximum per instance cost for this system.
-
Average total cost for all instances of this system.
-
Maximum total cost of all instances of this system.
-
Average cost for this instance.
-
Maximum cost for this instance.
No information is captured on individual emitters, so you will only see State data for emitters.
Performance
This section of the tool is highly experimental and subject to change.

|
Parameter |
Description |
|---|---|
|
Toggle ParticlePerf |
This option turns on the CPU cost when running performance tests. |
|
Run Performance Test |
Clicking this will run a performance test for the duration of frames indicated. After the test has been run, the output will be pasted in text format into the Output Log. The data is in
|
|
Toggle Baseline |
Each Effect Type has a baseline that is set in the System Properties of the Niagara System. When enabled, as a performance test is run it will measure the cost of the system in the level against the baseline cost of that Effect Type. |
|
Enable Async Simulation |
Click to enable for all Niagara simulations in the level. Quickly enabling or disabling this setting can help to determine whether an issue you're experiencing is related to this setting. |
|
Disable Async Simulation |
Click to disable for all Niagara simulations in the level. Quickly enabling or disabling this setting can help to determine whether an issue you're experiencing is related to this setting. |
Session Browser
The 4th tab in the Niagara Debugger is the Session Browser .

The Session Browser drives where all tests are run on the other tabs of the Niagara Debugger. In the Session Browser you will see any sessions that are active at that moment. In the case of this screenshot, the only available session is on the application running on the local device.
If you have sessions running on a console, or other devices, you can output the Niagara Debugger information onto those devices by selecting them in the Session Browser.
You can then return to the Debug HUD tab to adjust the display settings.