Choose your operating system:
Windows
macOS
Linux
This page provides guidelines and best practices for how to optimize mobile performance while getting the best possible fidelity from Mobile HDR features. This includes:
-
Information about what factors contribute to your performance budget on mobile devices
-
Best-practices for packaging projects with Mobile HDR features enabled
-
A walkthrough of the tools available to gauge performance bottlenecks within your Unreal Engine applications
The following links contain helpful information for regarding general performance topics on Android:
Knowing Your Performance Budget
The target device for your application has a finite amount of resources available, both for keeping objects in memory and processing them. When building your application, you must decide what to spend those resources on. You should familiarize yourself with your device's capabilities in terms of the speed, threads, and bandwidth for your CPU and GPU, as well as your device's memory, graphics memory, and available disk space.
You should also benchmark your device to understand how it will run and where it will encounter performance bottlenecks. You can benchmark a device by running a demanding application or tech demo on it, then observing its performance stats.
Console Commands for Displaying Performance Stats
You can check performance stats using a series of console commands . To open the developer console on a mobile device, tap the display using four fingers at once. This will open an onscreen keyboard and a prompt where you can enter console commands.
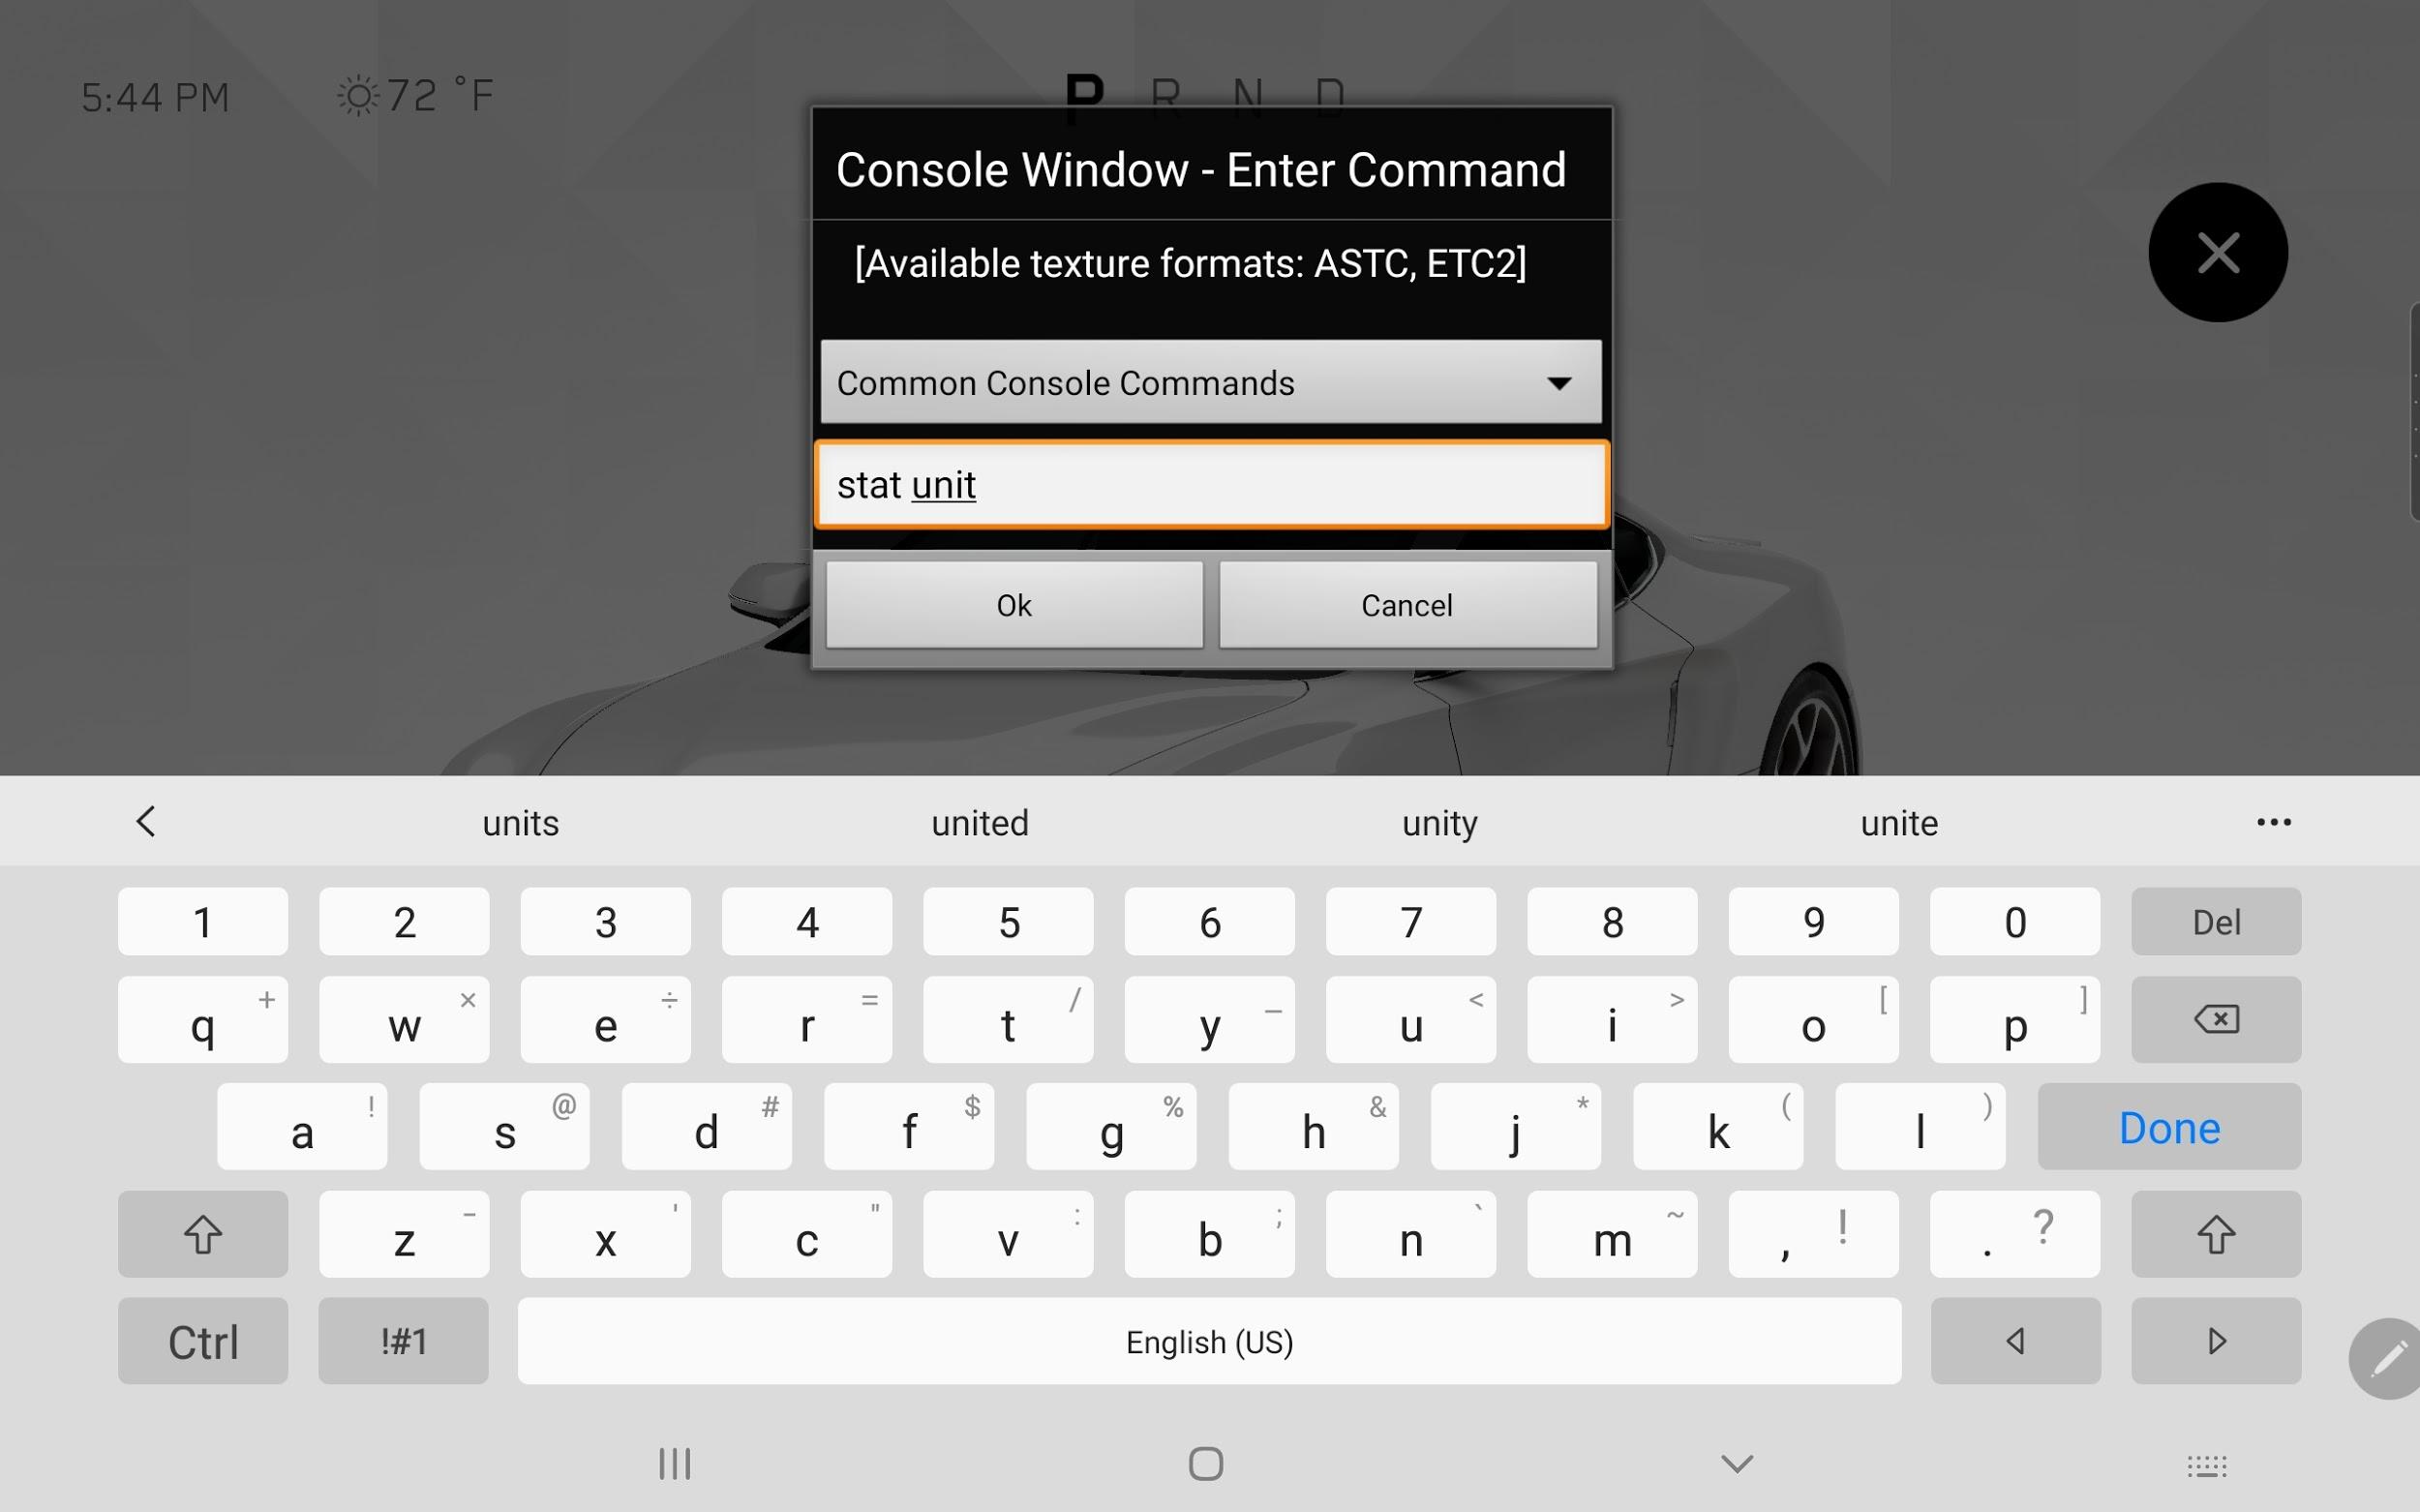
The console window displayed in a mobile application.
The console and the four-finger tap command are only available in Development builds. It is not available in Shipping or Testing.
Within the console, you can enter commands to display debug information to the screen. The following table includes a list of commands that provide performance information:
|
Command |
Description |
|---|---|
|
Stat GPU |
Displays the amount of time in milliseconds used by the GPU for different processes. Some devices running Vulkan may support stat GPU, but it is not supported directly on most mobile devices. |
|
Stat Unit |
Displays the amount of time in milliseconds used by the CPU for different processes. Also displays the game thread, rendering thread, and GPU times. |
|
Stat UnitGraph |
Displays a graph showing CPU and GPU utilization over time. This can help identify spikes. |
|
Stat TextureGroup |
Displays the amount of memory used by different pools of textures. |
For more console commands you can use to analyze your application's performance on-device, refer to Stat Commands.
Common Performance Factors
Now that you know where to look for performance data on your device, this section will familiarize you with the factors that most often affect performance in Unreal Engine's mobile renderers. By understanding which of these elements is impacting your application and how, you can quickly identify and address problems using Unreal Engine's diagnostic tools.
Normal Maps vs. High-Vertex Meshes
Unreal Engine's mobile renderers are efficient at rendering large numbers of vertices, whereas high-quality normal maps on mobile renderers can have issues with bit depth and have a greater performance cost than a high-polygon model.
On lower-end hardware, normal maps can greatly enhance the quality of reflections and lighting on the surface of a model. However, subtle shapes like body panels on a car can exceed the 8-bit deltas normally used for these maps, resulting in visible banding in the final render.
You can use 16-bit normal maps to compensate for this, but the pixel cost for 16-bit normals exceeds the vertex cost of a higher density mesh. 16-bit normals are uncompressed in the engine, which means they are also eight times the size of a regular normal map.
In the example below, we use high-density body panels with no normal maps. When targeting the Galaxy Tab S6, our body panels combine to about 500,000 vertices.

Best Practices for High-Resolution Normal Maps
Baking high-resolution vertices into a normal map for a low-poly model can be a complex process, and many factors can reduce the quality of a normal map texture by the time it is inside the engine. There are many tool sets for baking normal maps, but we recommend XNormal . The process we use for Xnormal is roughly as follows:
-
Bake the normal map in Xnormal as an 8k TIFF with 4xAA.
-
Import the TIFF into photoshop, then downres it to a 1k texture.
-
Apply a Guassian Blur with a value of .35px.
-
Convert the image from 16-bit to 8-bit.
-
Export the image to a 24-bit TGA.
-
Import the final normal map into Unreal.
To ensure the surface normals used in the baking process are the same as what is present in the engine, you should export the optimized normals from inside Unreal. Import the baking model into Unreal, choose to create its own normals, then export the baking model from Unreal to be baked in Xnormal. This is an important step when creating high quality normal maps, as Xnormal needs to be aware of the surface normals of the mesh to apply the offsets from the high resolution model.
Finally, there are two options that will reduce artifacts when rendering static meshes :
-
Use Full Precision UVs
-
Use High Precision Tangent Basis
Both of these settings are available in the Static Mesh editor , in the Details panel under the LODs .

Draw Calls
Draw calls are lookups for assets, which happen every frame. The number of draw calls your application uses depends on the number of unique meshes in your scene, as well as the number of unique material IDs each mesh is using. Currently, a high number of draw calls are the biggest contributor to low graphical performance, and you should reduce them as much as possible.
As an example, a highly optimized car model might only have five or six separate meshes, and each one of those components might only have a single material.
A good target for draw calls in an optimized scene is roughly 700 on a Galaxy Tab S6, and less than 500 on lower-end hardware. In projects for HMI, which tend to use highly unique or complex materials, 100 draw calls would be a good target on a Galaxy Tab S6, while less than 50 would be preferable.
You can output your draw call count with the console command Stat RHI .
Keep in mind that draw call count will change based on whether you are in PIE or on device. |
Reducing Mesh Count
The easiest way to reduce draw calls is to reduce the number of unique meshes in your world. You can do this by combining as many objects as possible into one mesh using a digital content creation (DCC) toolset, such as Maya, 3DSMax, or Blender, before importing them to Unreal.
Reducing Material ID Count
There are several possible options for reducing the number of unique materials on a mesh.
The simplest method is to use a program like Substance Painter , which integrates multiple materials into the same texture. This enables you to take advantage of a vast number of material types in a very simple Unreal material, which you can then use as the basis for material instances with simple texture inputs. This can also reduce material instruction counts, which further improves performance.

The second method uses masking for a more procedural approach. Materials can denote certain characteristics of a surface, like color, roughness, or metallic qualities. Instead of using a separate material for different parts of a mesh, you can use masks to separate parts of a mesh's UVs and apply different settings to each section. You can create a basic mask using a black and white texture, but it is more efficient to use vertex color .


In the example below, vertex colors are used to define different material types, and the material defines parameters which can influence the look of those pieces individually. Vertex color masking is more efficient and creates a sharper separation, as it does not rely on texture resolution.

A material using vertex colors to separate different material types.
Materials
Material complexity can increase the pixel cost of a render. The more instructions there are for each pixel, the more time the render needs to spend calculating its final value. Opaque materials are the least expensive, but can differ greatly based on the shading model or the base shader code.
You can find a readout on the instruction count of a material in the Stats window inside the Material Editor .
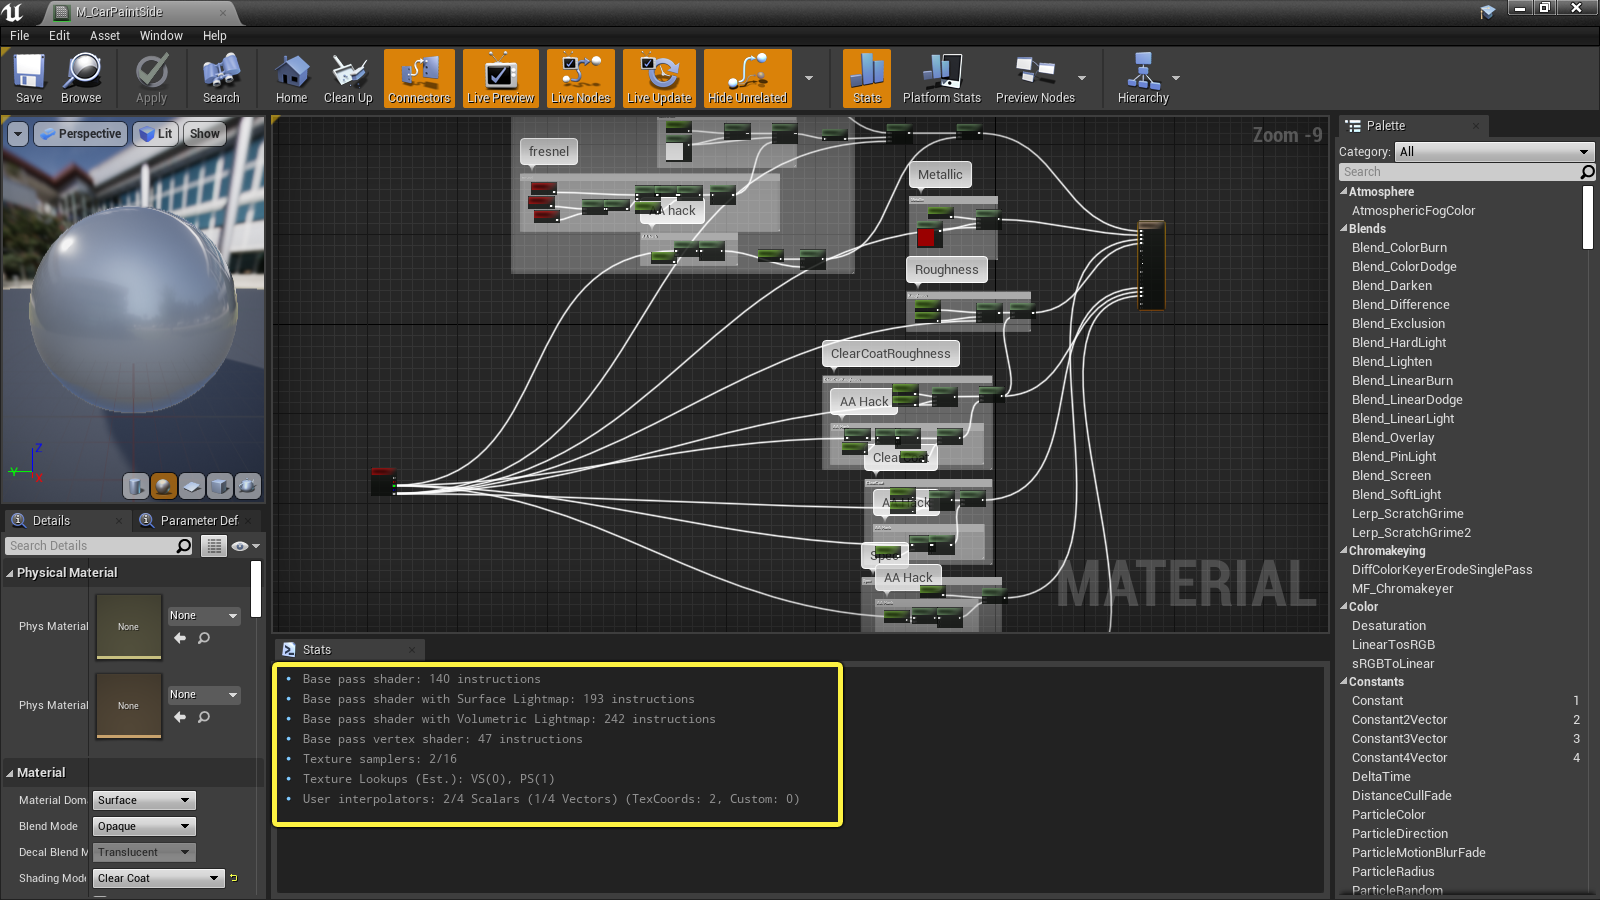
The Stats window displaying instruction count.
The instruction count will also increase depending on the number of math functions there are in a material. The more nodes there are, the more expensive the material will be to render. Some specific operations also have a higher cost. Try to limit the instruction count when building more complex materials.
Translucent and transparent materials are some of the most expensive material types. Individual layers of translucency have an expensive per-pixel cost, and when multiple layers of transparency are stacked and rendered, there is a much greater cost. This is known as overdraw .
Headlights and taillights for vehicles are examples of problem areas with transparency. In many cases, we use hand-painted texture maps instead to reduce material complexity. Complex shapes and depth can be illustrated well, even with a flat texture.

Optimizing Texture Resolution
High-resolution textures require a lot of space, both to store on a device and in a device's texture memory, and larger textures require more pixels to render and process. While they can increase fidelity, there are diminishing returns to texture size given your device's screen resolution and the viewing angle of the texture. It is important to use the smallest texture possible to obtain the desired level of fidelity.
To determine your texture needs, first you need to finalize the camera location and the field of view (FOV) from which you will view your model. This will help determine the screen space of all the meshes and materials.
Once a camera location is determined, you can use a special debug texture to determine the texture resolution to use for the various materials. This texture uses the behavior of mipmaps to determine what resolution is necessary for different components, applying different colors in each mipmap. This makes it easy to identify which mip the material is using, and what texture resolution should be used.
Plug the included texture into the Emissive channel of an unlit material, then apply that material to your mesh. When viewing the mesh from the proper camera distance, the color coding will indicate which mip level the engine is using to render. The highest level observed should be the native texture size of your Normal and Ambient Occlusion maps.

Package Size and Boot Time
When packaging an application and its assets, there is a tradeoff between package size on disk and runtime bootup performance.
When ZLib compression is enabled, the package size of your application will be smaller. However, this requires more CPU time loading the application, which can slow down bootup speed. For optimal boot time, you can disable compression.
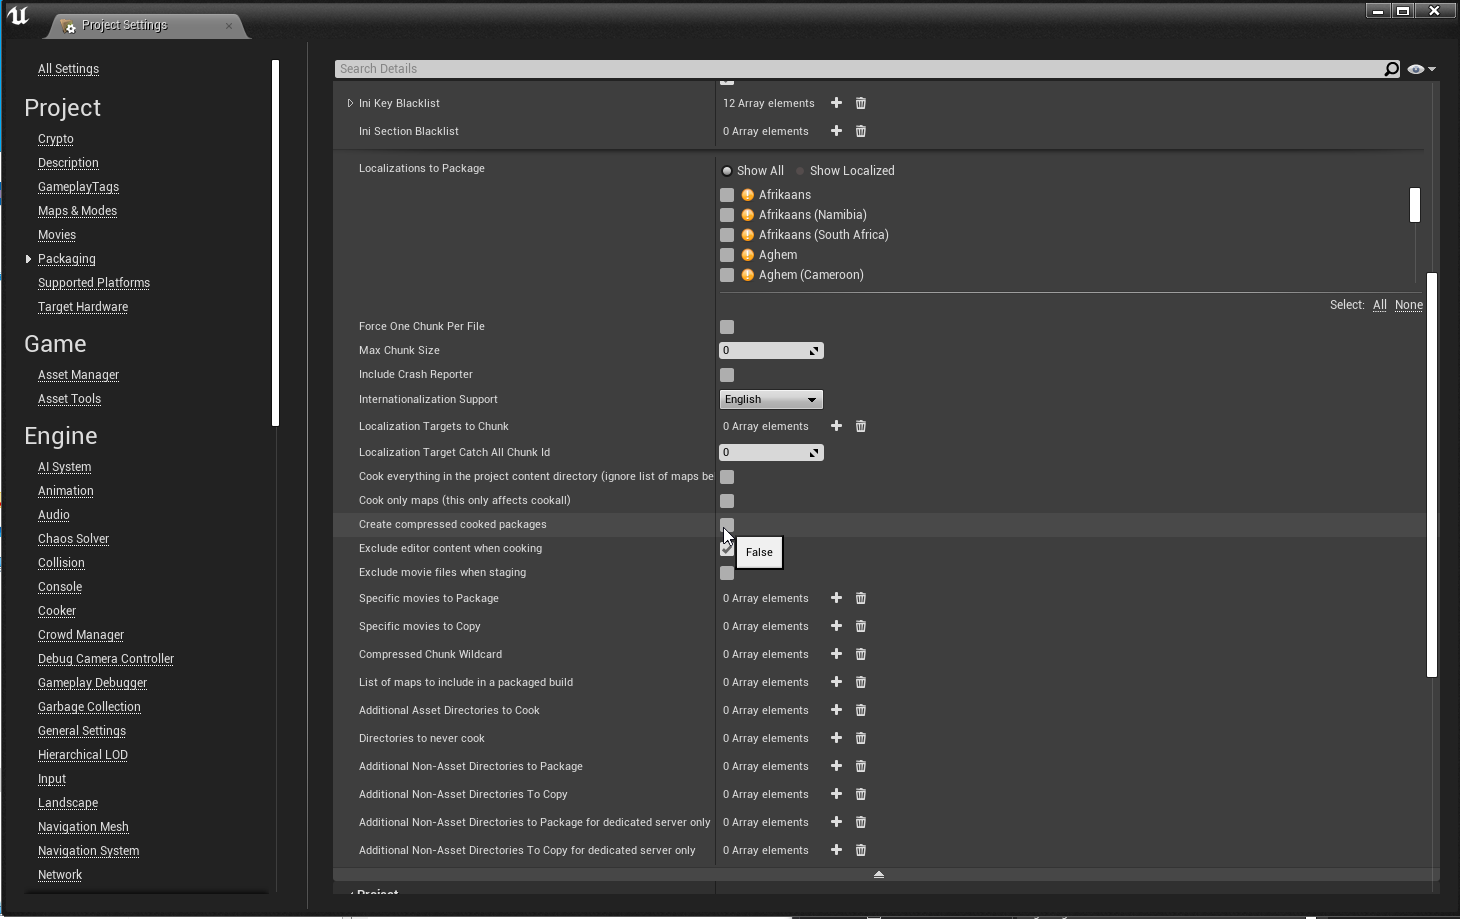
You can find Zlib compression settings in Project Settings > Packaging.
Recommended Streaming Settings
The following streaming settings are recommended in
DefaultEngine.ini
. These provide extra time at the start of an application for asynchronous loading of assets, which can improve startup time.
[/Script/Engine.StreamingSettings]
s.PriorityAsyncLoadingExtraTime=275.0
s.LevelStreamingActorsUpdateTimeLimit=250.0
s.PriorityLevelStreamingActorsUpdateExtraTime=250.0
Recommended Packaging Settings
The following packaging settings are recommended in
DefaultEngine.ini
. These settings reduce the amount of compression being utilized when packaging assets, as uncompressed .pak files load significantly faster than ZLib compressed files on startup.
[/Script/UnrealEd.ProjectPackagingSettings]
bCompressed=False
BuildConfiguration=PPBC_Development
bShareMaterialShaderCode=True
bSharedMaterialNativeLibraries=True
bSkipEditorContent=True
Analyzing Package Size on Disk
Unreal Engine features several useful tools that can provide insight into the data footprint of assets.
Size Map
The Size Map reads and compares the relative memory consumption of assets in the editor. To use it, you must enable the AssetManagerEditor plugin. After that, you can access it by right-clicking on a folder in the Content Browser and selecting Size Map from the context menu.
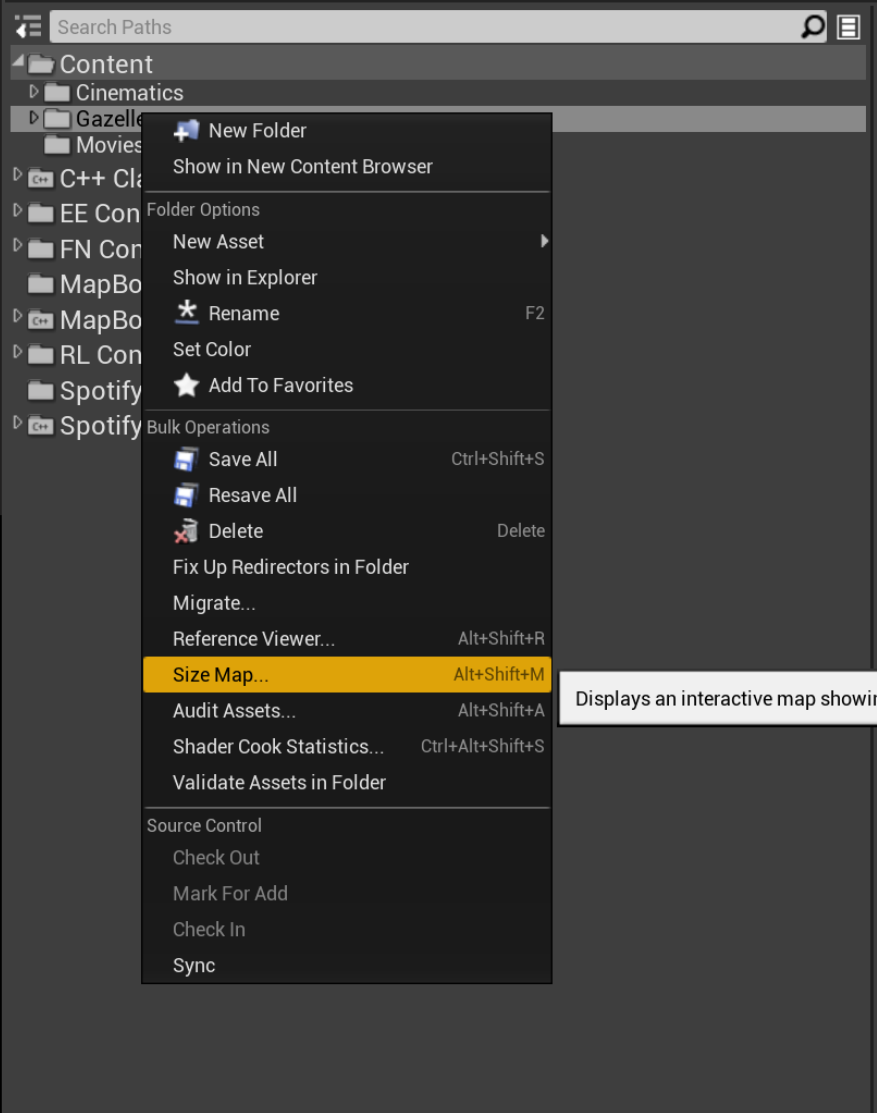
The Size Map displays a window with icons representing the amount of memory that folders and files consume. The larger the icon, the more space a file consumes.

For more information about using the Size Map, refer to Cooking and Chunking .
The Size Map reads the footprint of assets as they are used within the editor. After you package your project, memory consumption will be different. This is due to the different types of compression which happen during the cook process. As a rule of thumb, the size map will represent the largest possible size that an asset could take up.
Statistics
The Statistics tool offers more detailed information about asset usage within a level . You can locate it in the Window dropdown.
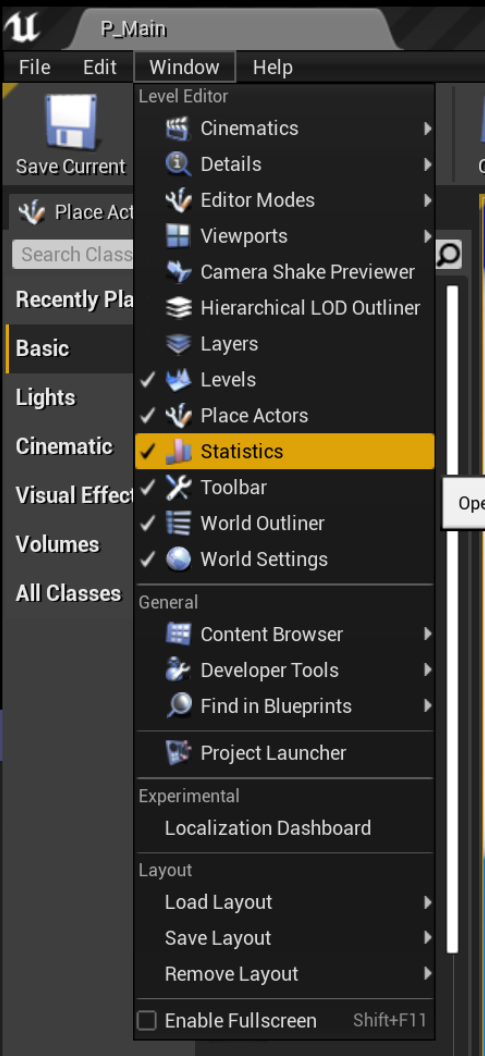
The Statistics window breaks down the number of assets in your level files, and can display either all levels or only specific levels. Primitive Stats lists information about the number of triangles, memory consumption, and count.
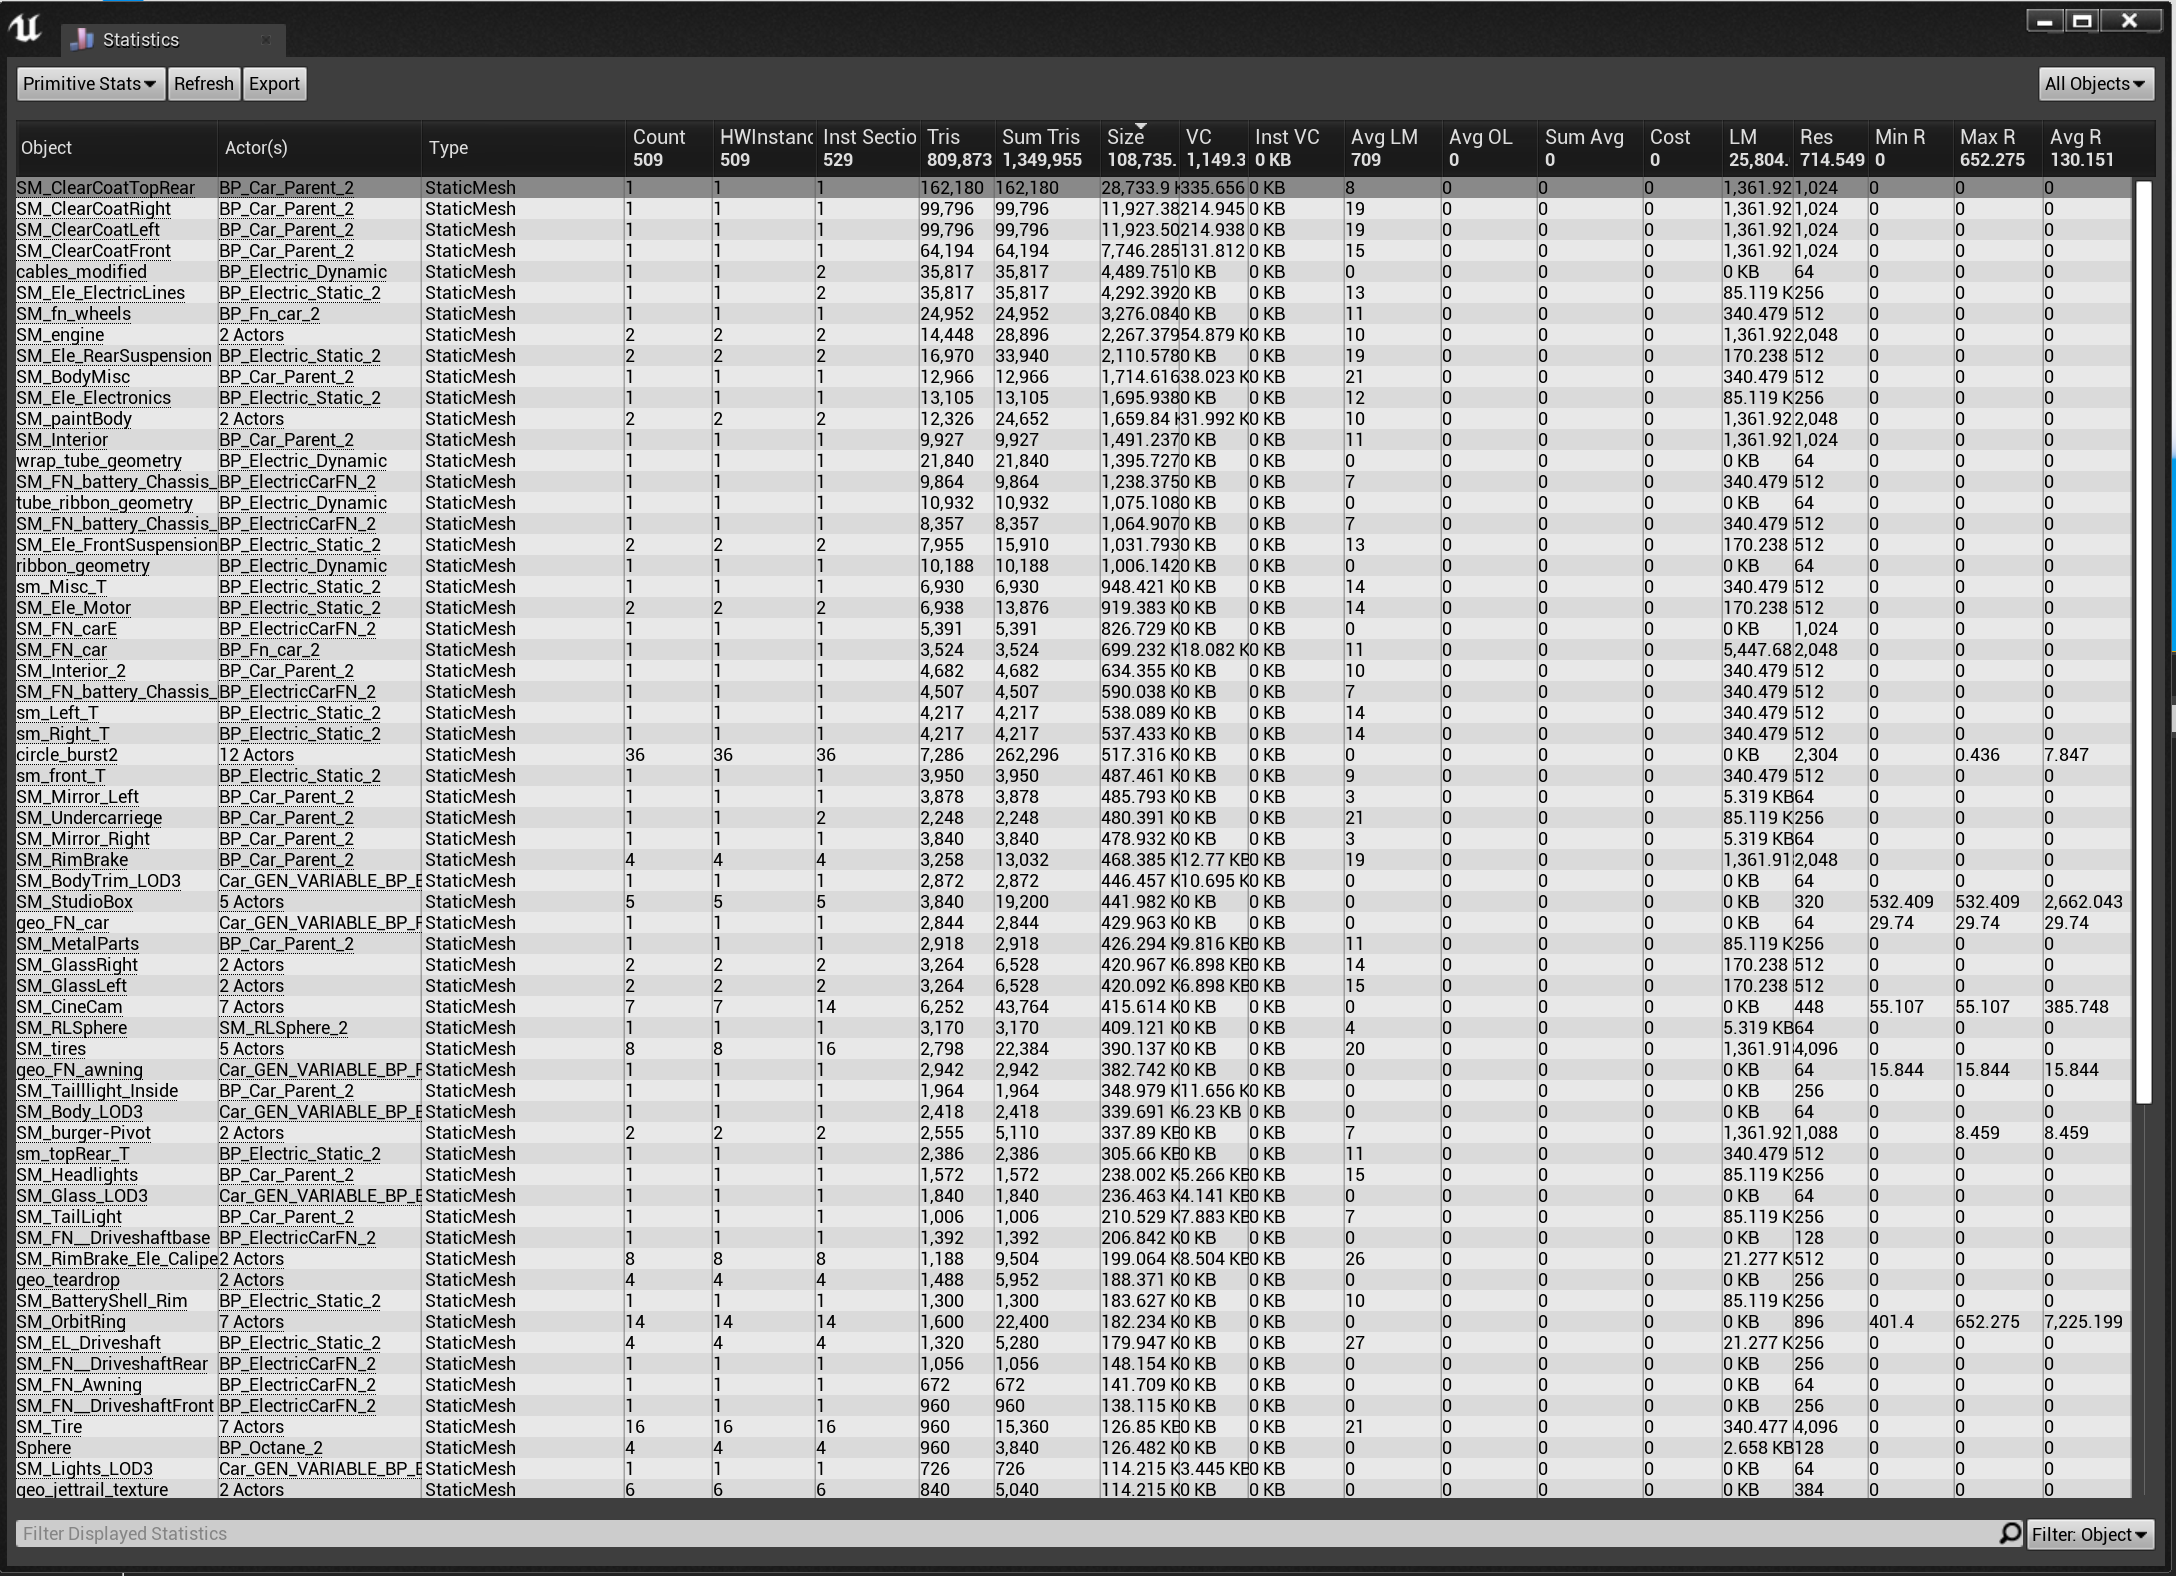
The Statistics Window displaying Primitive Stats.
Other data displayed in this list includes texture usage and static mesh lighting information. The Statistics window's list mode can quickly illustrate which assets are consuming the most memory. The Cooker Stats data is also extremely useful as it lists all the assets which were cooked in the last package process.
Memory Reports
While the Statistics and Size Map tools show you the data footprint of your files inside the Unreal Editor, the console command
Memreport -full
can be used from an installation of your application launched on a target device. This provides a detailed and accurate look at your files' size as they will exist with your device's compression settings.
Once the app is built in Development configuration and loaded to the device, you can pull up the console window and enter the command. This memory snapshot is saved within the project's directory, on the device. The directory will usually be
UE4Game/[YourApp]/[YourApp]/Saved/Profiling/Memreports/
, but this can vary.
The
.memreport
file is a text file which can be read in most text editors. The beginning of the text includes some information about the allocated memory and pool sizes, while the bulk of the text shows a record of what levels were loaded, RHI stats, render targets, scene information, and more. All of this information is valuable as it represents the actual data which made it through the cooking and packaging process.
If you search for the term Listing all textures , you will find a list of every texture in your application, along with detailed information about the texture type, group, size, and memory footprint. The list is sorted by memory size, with larger textures presented first. This is a quick and easy way to spot what textures are consuming the most memory.
Analyzing Boot Time
The factors that affect boot time include the following:
-
The amount of time required to load and decompress initial assets
-
The overall size of your application
-
Any plugins that need to be activated in your user's installation
-
The amount of string data that needs to be parsed
-
Any memory allocation or fragmentation on the user's device
There are several different tools available to analyze your application's boot time, but Unreal Insights is the most recommended, as it can profile performance data remotely from a target device. For full information about this toolset, refer to the Unreal Insights section .