Choose your operating system:
Windows
macOS
Linux
In order to understand and use the content on this page, make sure you are familiar with the following topics:
Being able to debug your project on its target device is critical to tracking down performance issues and other possible project breaking errors. In the following section, you will learn what tools are available to assist you in debugging your Gear VR projects and how to use them.
Enabling Gear VR Developer Mode
Having the ability to view your Gear VR Project without having to use the Gear VR Headset can significantly speed up the time it takes to debug an issue by allowing you quick and easy access to things like Unreal's console. In the following sections, we will cover how you can set up your Gear VR projects so that they can be viewed without the Gear VR Headset.
Before you can do this, you must make sure that you have a Gear VR application installed to your phone that has your device signature associated with it. This can be a downloaded or compiled application of your choice.
-
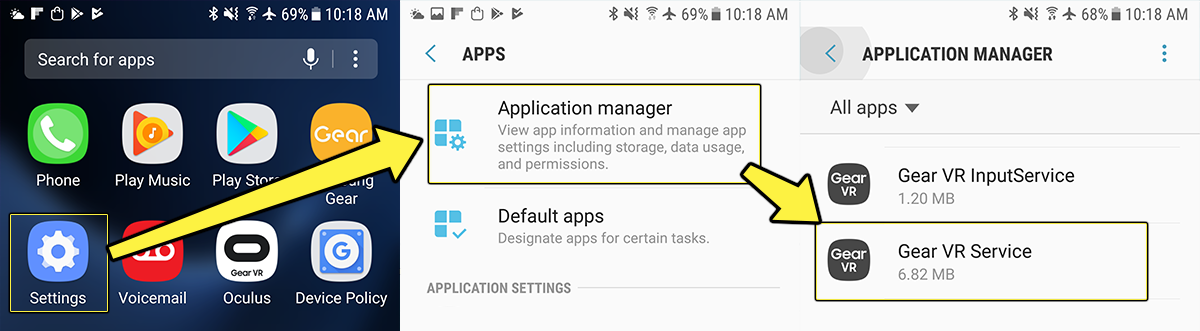
First, on your Samsung Galaxy Smartphone go to Settings > Apps > Application Manager > Gear VR Service .
![T_GearVR_Dev_Mode_01.png]()
Click for full image.
-
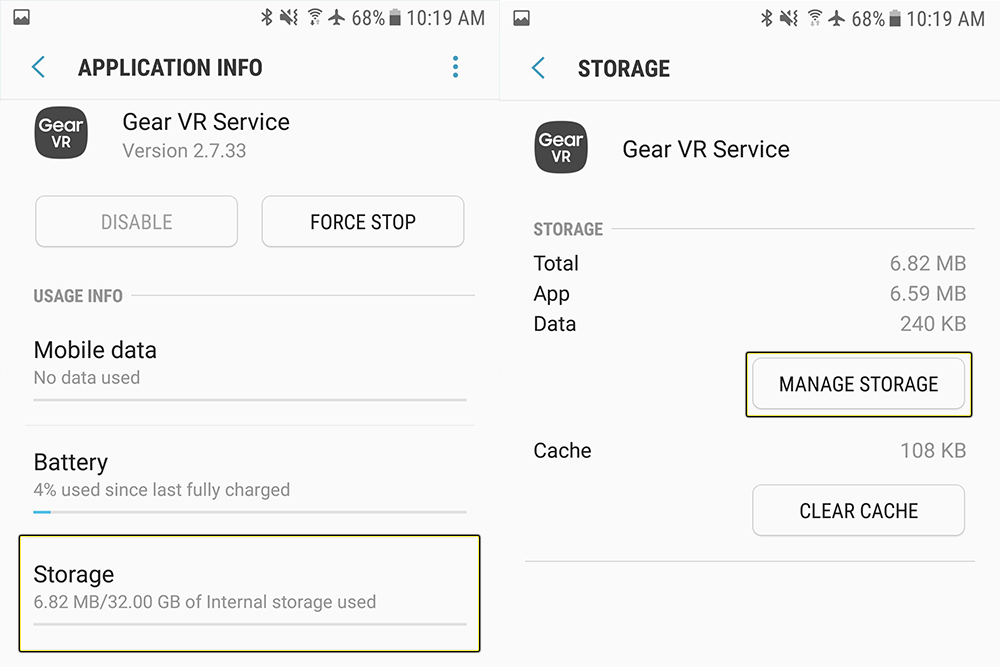
Next, tap on Storage then tap on Manage Storage .
![T_GearVR_Dev_Mode_02.png]()
Click for full image.
-
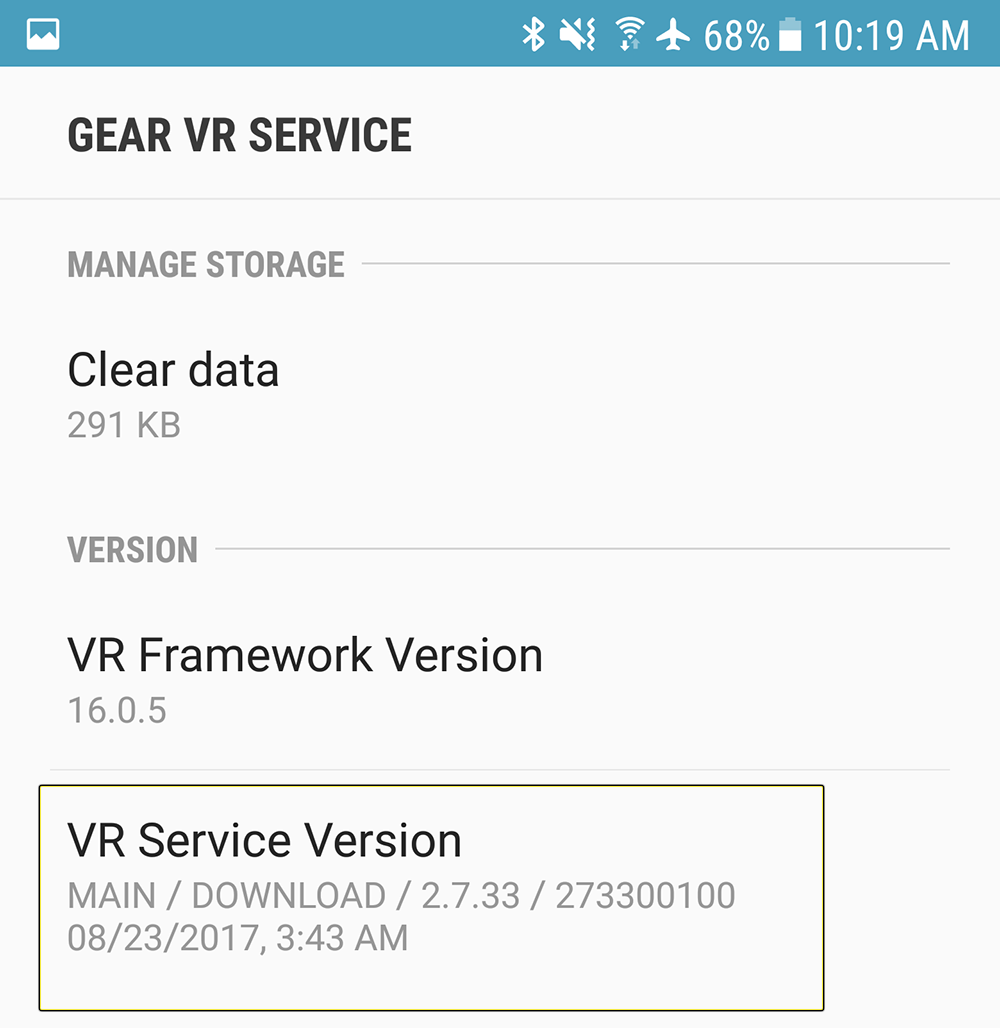
Then, tap on the VR Service Version 6 times.
![T_GearVR_Dev_Mode_03.png]()
Click for full image.
-
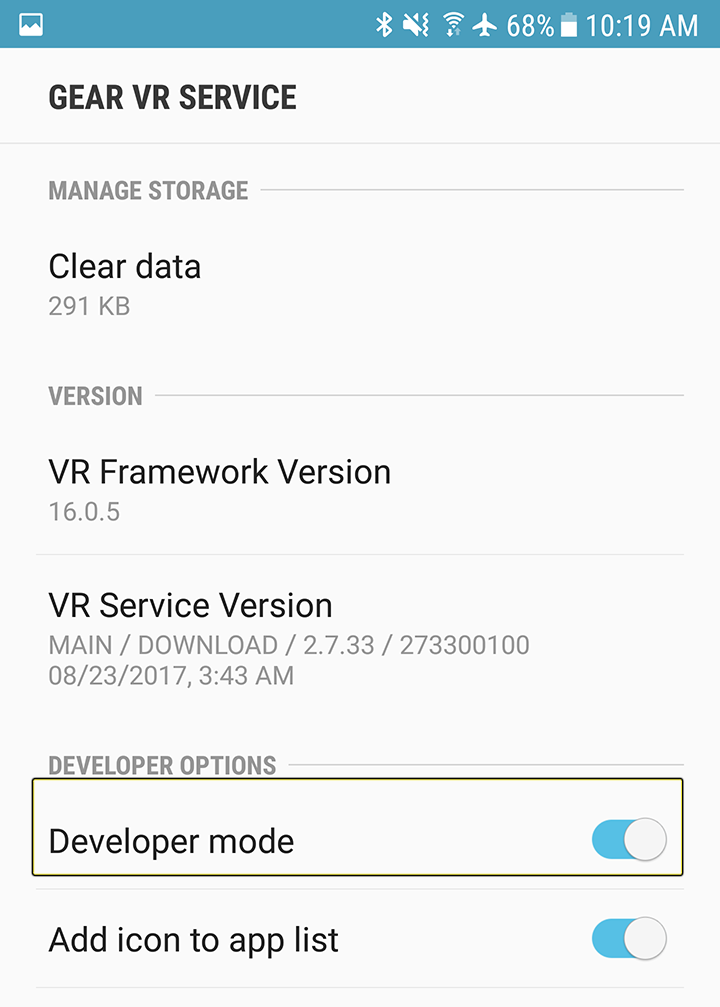
You should now see a scan process happen and when completed you should see the Developer Mode toggle on the screen.
![T_GearVR_Dev_Mode_04.png]()
Click for full image.
-
Now, you should be able to launch your Gear VR Project and have it display without having to use the Gear VR Headset.
Be careful when enabling VR Developer mode as it can drastically drain your phone's battery. This is because you are overriding settings to disable the screen when the Gear VR Headset when not in use.
Disabling Gear VR Developer Mode
If for any reason you need to disable VR Developer mode, slide the Developer Mode slider from On to Off and VR Developer mode will be disabled.


Enabling the UE4 Console
The UE4 Console is a potent tool that allows you to look at, and in some cases, affect data that is currently being displayed in UE4. Accessing the UE4 console on Mobile devices requires a slightly different approach than what you might be used to on PC and is explained below.
You can get a full list of available console commands by entering DumpConsoleCommands into the console while on a PC and Unreal will then list all available console commands in the console.
-
First, make sure that you have enabled Gear VR Developer mode on your phone. This way you can launch your project and see it without having to use the Gear VR Headset which, if used, would prevent you from being able to touch your phone's screen.
![T_GearVR_Dev_Mode_04.png]()
Click for full image.
-
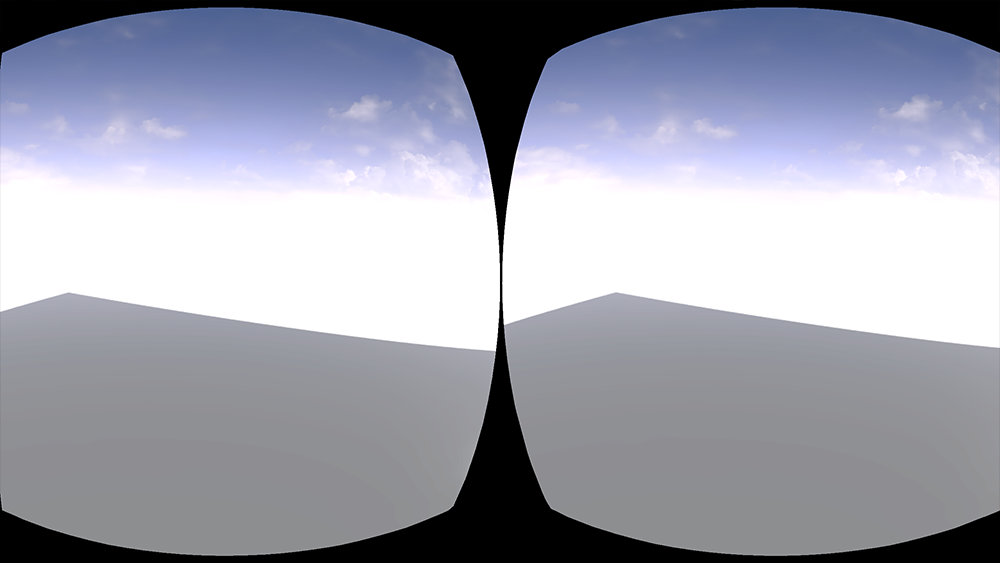
Next, launch your Gear VR project by tapping on the project's icon to start it. When the project has been started, you should see something looking like this on your phone.
![T_App_On_Phone.png]()
Click for full image.
-
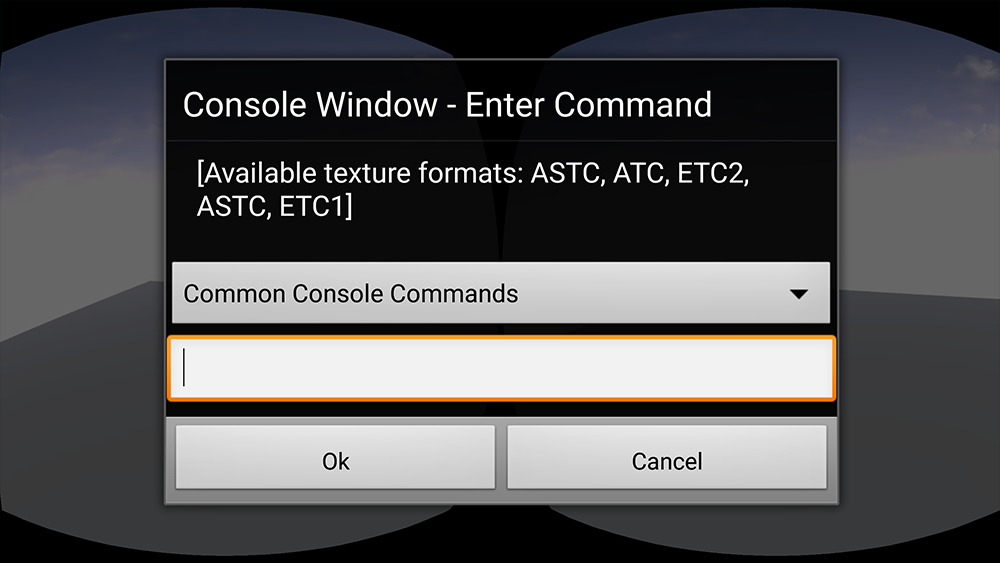
With your Gear VR project now running, tap the phone's screen with Four (4) fingers at once to open up the Unreal Engine Console. If done correctly, you should see something like this on your phone's screen.
![T_GearR_Open_Console.png]()
Click for full image.
-
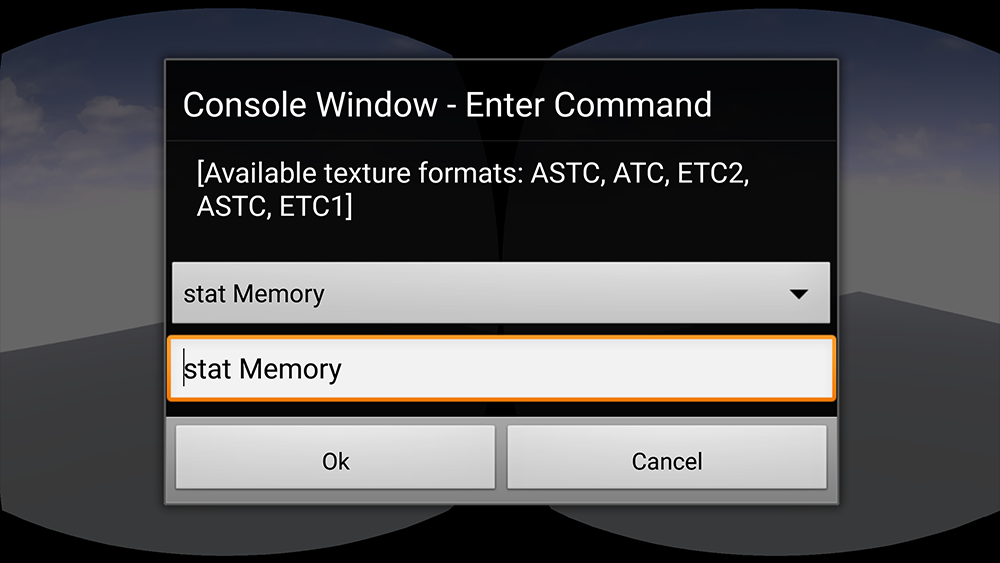
Now input a console command you wish to use in the input box and then press the Ok button. For this example, we will use the Stat Memory command to see how much memory the project is using.
![T_GearR_Input_Command.png]()
Click for full image.
-
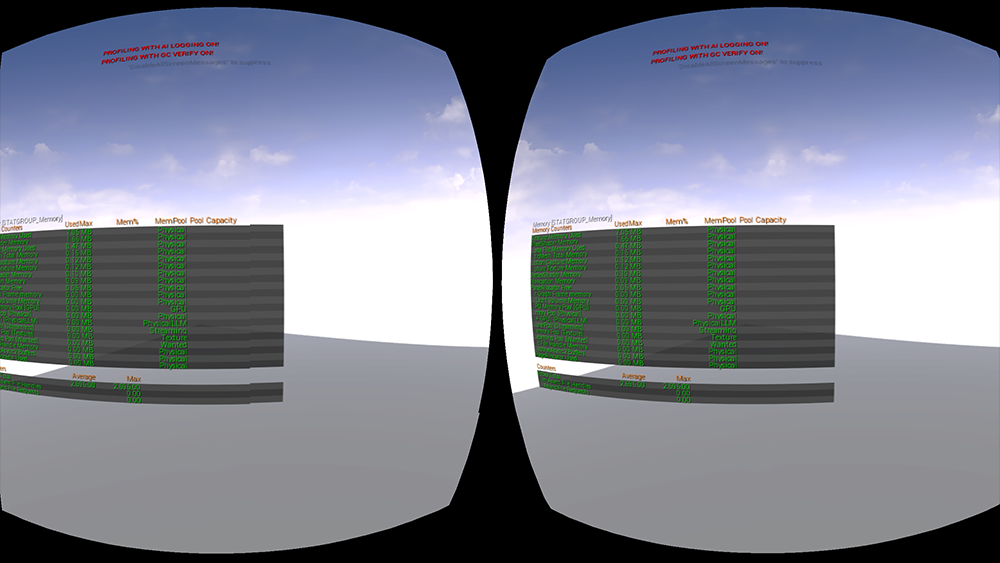
Once the Ok button has been pressed, your project should now be displaying how much memory is being used (and by what).
![T_GearR_Displaying_Memory.png]()
Click for full image.
-
When you are done debugging, or if you just wish to clear the screen of debugging information, you can input Stat None to clear the screen of all of the debug information.
The best option for console debugging with the Gear VR Headset is to use a Bluetooth keyboard. This way, you can use the console without having to remove the phone from the headset.
Viewing Gear VR Debug Logs
Having the ability to view debug logs is of critical importance when developing any 3D project. Debug logs can provide vital information and insight into why your project is not working and, in some cases, even make suggestions as to what you can do to fix things. In the following section, we will go over what you need to do to get debug logs from your Smartphone.
Check out the official Android documentation for more detailed information on all of the various things you can do with Logcat .
-
First, make sure that your Smartphone with the application you want to get debug information from is plugged into your PC via USB.
-
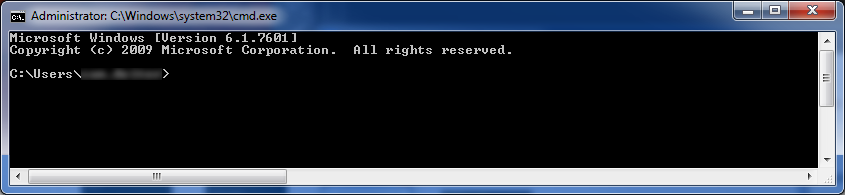
Next, open up a Windows Command Shell by pressing the Windows Key + R and then entering CMD in the Run dialogue box.
![T_Open_CMD_Prompt.png]()
-
Press the Enter key to launch the Windows Command Line.
![T_Windows_CMD.png]()
Click for full image.
-
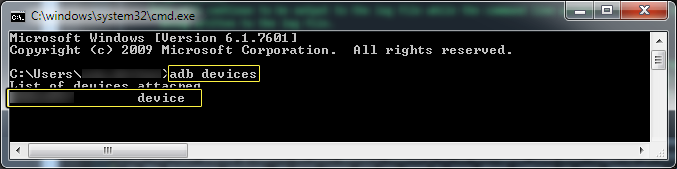
Now, input ADB Devices into the command line window and press Enter to display devices attached to your PC.
![T_Windows_ADB_Devices.png]()
Click for full image.
If no devices are listed in ADB Devices make sure that you have gone through the Gear VR Prerequisites setup section and then attempt this step again.
-
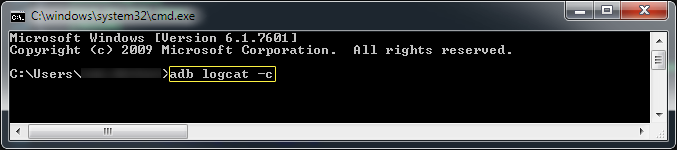
Now clear the log cache to ensure that we are getting current debug information by entering the following command.
adb logcat -c![T_ADB_Clear_Log.png]()
Click for full image.
-
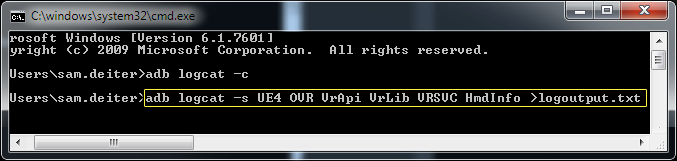
With the log now cleared of old data, launch the application on your Smartphone and enter the following command to get the log information.
adb logcat -s UE4 OVR VrApi VrLib VRSVC HmdInfo >logoutput.txt![T_ADB_Get_Log.png]()
Click for full image.
To see the live output of the log, omit the >logoutput.txt part and all log updates will happen in the command line window.
-
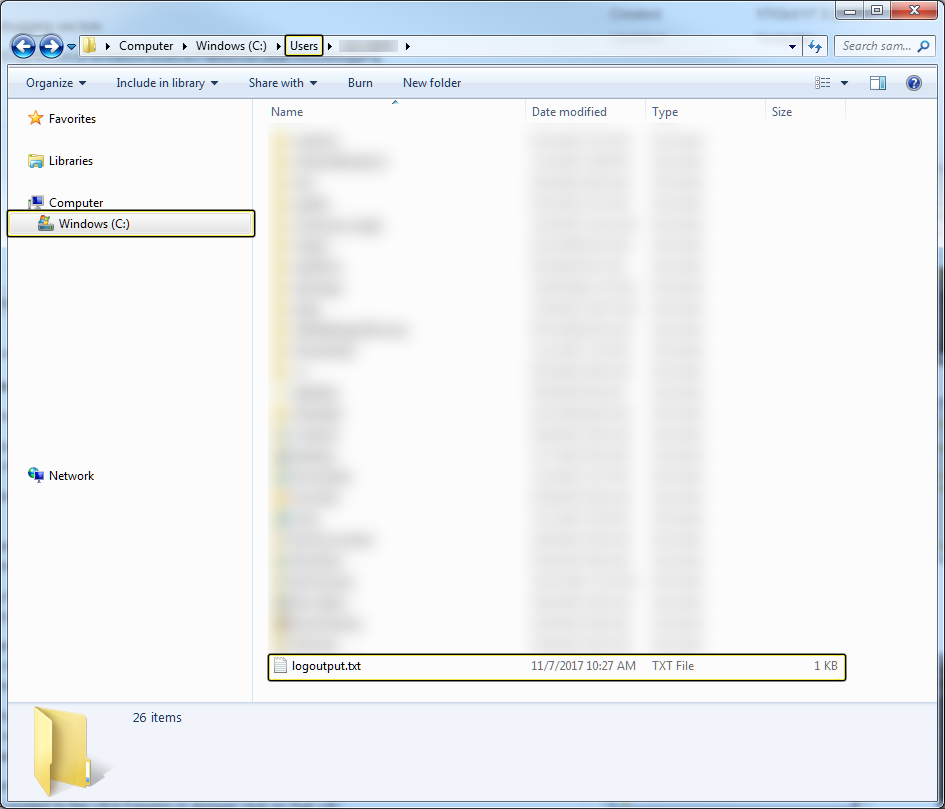
To complete the log capture, press CTRL + C on the keyboard and when completed, you should now have a log file named, logoutput.txt , that is saved to your Users folder in Windows.
![T_ADB_Log_Location.png]()
Click for full image.
Data will continue to be output to the log file while the command line window is open and running the ADB logcat command. To stop this, all you have to do is press CTRL + C and data will cease being written to the log file.
-
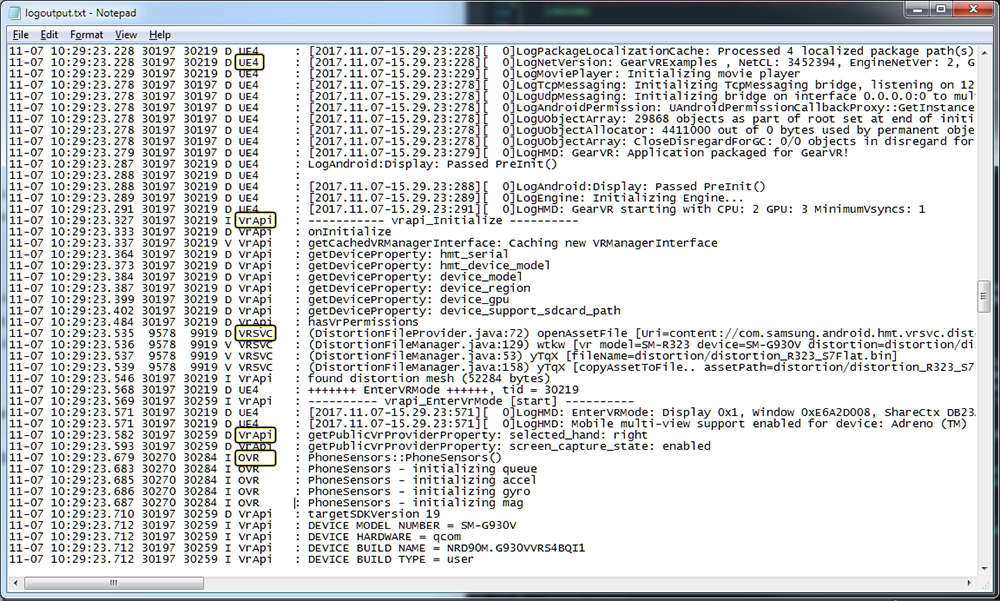
The information that is contained within the log file was generated from adding UE4 , OVR , VrApi , VrLib , VRSVC , and HmdInfo to the logcat command. When you look at the log file that was created and search for any of those terms, you will find all debug information related to those terms.
You can see an example of this in the image below, some of the terms used (OVR, UE4, Vrapi, and VrApi) show up in the log with information that is related to those terms.![T_ADB_Log_Info.png]()
Click for full image.

If your Gear VR Project is not starting up for some reason, using the logcat command is an excellent way to see exactly where your project is failing and why. It also provides you with detailed information about the problem that can then be posted to the UE4 Forums or Answer Hub so that you can get help with the issue.
Wireless Deploying & Debugging
Getting debug information or deploying to your Smartphone while it is in the Gear VR Headset is impossible due to the only USB port being used by the Gear VR Headset. However, you can work around this issue by using your Smartphone's Wi-Fi connection to send debug information to your development PC. You can even deploy projects in this manner; however, it is extremely slow when compared to using the USB cable. In the following section, we will cover all you need to know about setting up your Smartphone so that it can send debug information and be deployed over Wi-Fi.
Please note that for this to work, you have to have your development PC and Galaxy Note 4 on the same network.
-
Next, open up a Windows Command Shell by first pressing the Windows Key + R and then entering CMD in the Run dialogue box that is opened. Then press either the Enter key on your keyboard or just click on the OK button with your mouse.
![T_Open_CMD_Prompt.png]()
-
Once the OK button has been toggled, a Windows Command Line window like the following should now be displayed.
![T_Windows_CMD.png]()
Click for full image.
-
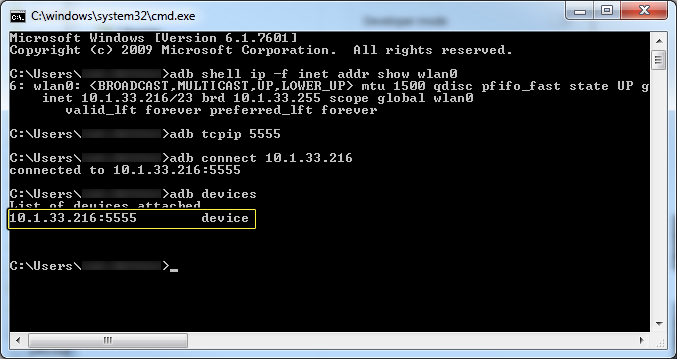
Now, enter the following command to see what your Smartphone's IP address is and make sure to take note of it. The IP address you want to use is the one that comes after inet .
adb shell ip -f inet addr show wlan0![T_ADB_Phone_IP.png]()
Click for full image.
-
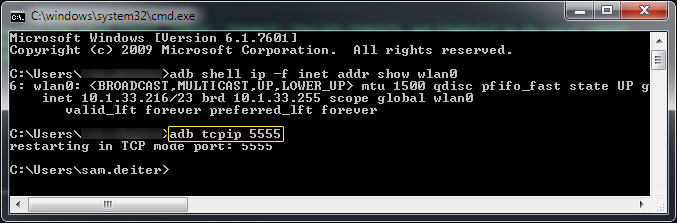
Next, enter the following command to change the network connection to TCP and set the port that it should be listening to.
adb tcpip 5555![T_ADB_Set_Port.png]()
Click for full image.
-
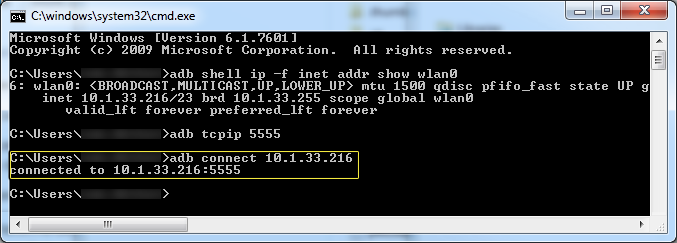
Once the port has been set, it is now time to connect to the Smartphone by entering the following command and pressing the Enter key.
adb connect 000.000.000.000 - Replace with your devices IP Address. -
You should now see a message that says connected to with the IP address of your device.
![T_ADB_Connected.png]()
Click for full image.
-
To make sure you are connected to Wi-Fi, enter adb devices into the command line window and press the Enter key, and you will now see that in the List of devices attached the IP Address used above is now the only attached device.
![T_ADB_Attached_IP.png]()
Click for full image.

With your Smartphone and PC now connected to one another via the network, you can now begin to get debug information from your Smartphone or even deploy projects to your phone without having to use the USB cable. However, keep in mind that deploying to your Smartphone from your PC over the network is slower than using the USB cable.
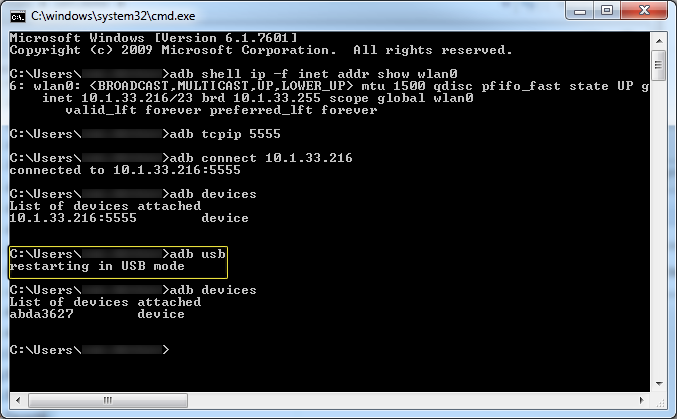
Return to Wired Deploying & Debugging
To return to using the USB cable for debugging and deployment, input the following command into the command window.
ADB USB
Click for full image.