Choose your operating system:
Windows
macOS
Linux

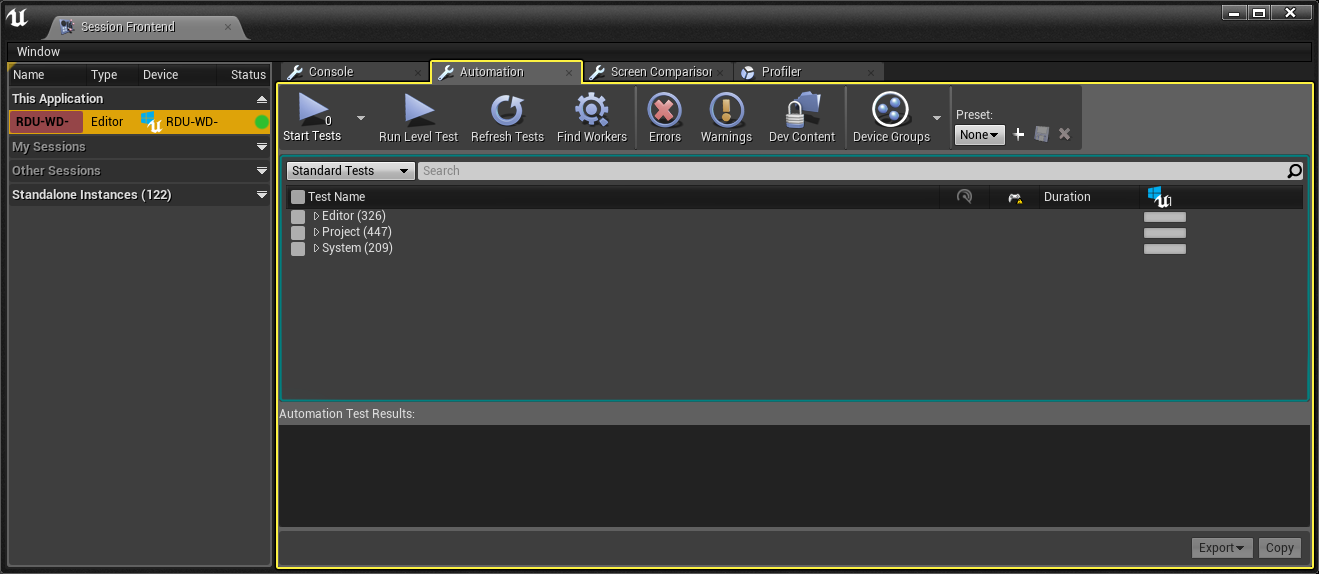
Session Frontend with the Automation tab in focus.
The Automation tab is part of the Session (Unreal) Frontend . It's located here because it enables you to run automation tests on any other devices that are connected to your machine or are on your local network.
There are two ways you can access the frontend suite:
-
Session Frontend - Opens the local Editor as an automation worker to run automation on external devices.
-
Navigate to Window > Developer Tools > Session Frontend
-
-
Unreal Frontend - Opens a standalone version of the Frontend that includes the Session Frontend, Device Manager, and Project Launcher.
-
Navigate to your [UE4 Root Directory] > Engine > Binaries > Win64 > UnrealFrontend.exe
-
Enabling Plugins
In the latest versions of Unreal Engine 4, all the Automation Tests have been moved from the Engine Content folder to their plugins that must be enabled before they will be visible in the Automation tab.
|
|
|
|---|---|
|
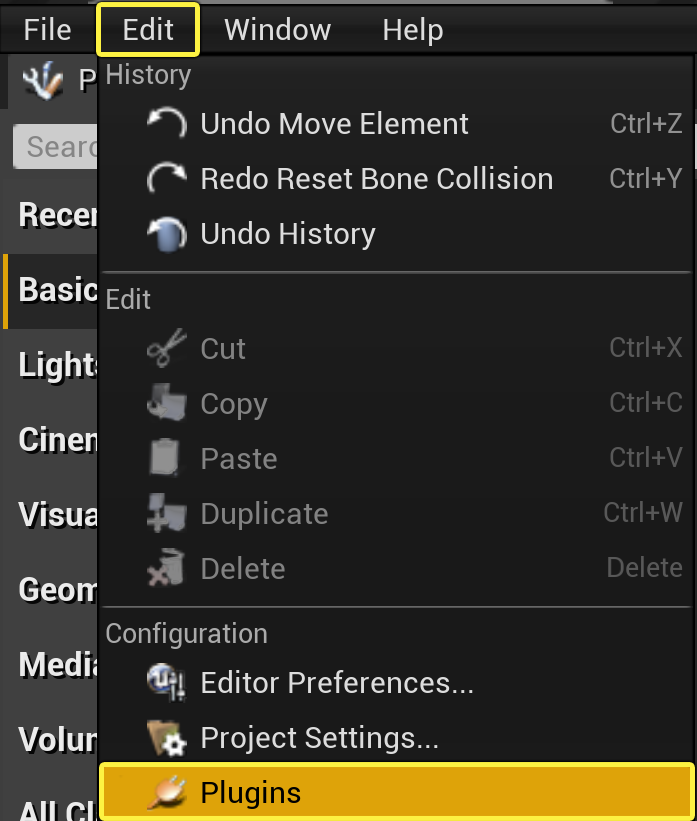
To enable the plugins, select Edit > Plugins > Testing . |
Plugins Browser with Automation Tests |

If you're using the standalone Unreal Frontend, all the automation tests will be available without any additional steps to enable it.
User Interface
When you open the Session Frontend, you'll have access to a few tabs, such as the Console, Automation, Screenshot Comparison, and Profiler. For all your automation testing needs, the Automation tab will house all of the functionality you need with some additional functionality falling under the Screenshot Comparison tab for rendering functionality comparison.
Click image for full view.
If you do not see anything listed in the Automation tab window, select an active session from the Session Browse on the left. For example, under This Application the machine named RDU-WD is selected.
Session Browser
The Sessions Browser enables you to connect to specific instances of the Editor. You will only see the Automation window populate with the available automation tests once a session has been selected.

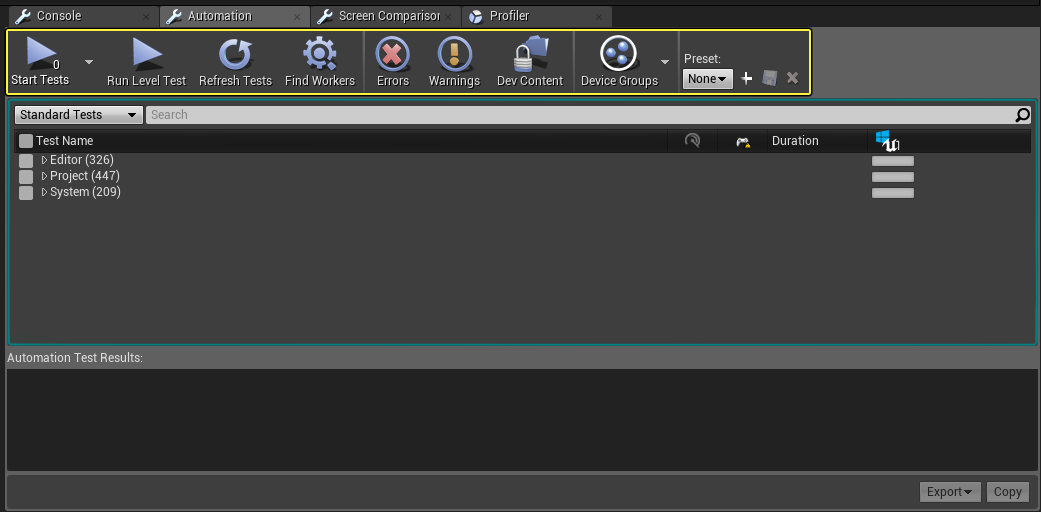
Toolbar
The toolbar in the Automation tab enables you to control how you start, refresh, and filter errors and warnings for your automation tests.
Click image for full view.
|
Icon |
Title |
Description |
|---|---|---|
|
|
Start Tests |
Starts and stops the currently selected automation test(s) that are enabled. The number of tests that will be run is also listed under the button for reference. |
|
|
Run Level Test |
If the currently loaded level is a test map, you can click this button to select the tests and run it immediately. |
|
|
Refresh Tests |
This will refresh the Test Name list for any test that is added to the project. |
|
|
Find Workers |
This will find local workers that can be used to perform the tests. |
|
|
Errors |
Toggles a filter for the Test window that displays any tests that ran into an error while attempting to complete. |
|
|
Warnings |
Toggles a filter for the Test window that displays any tests that ran into a warning while attempting to complete. |
|
|
Dev Content |
When enabled, developer directories will be included for automation tests. |
|
|
Device Groups |
Enables you to group the tests based on a series of options, such as the machine name, platform, operating system version, and much more. |
|
|
Preset |
Enables you to add your own presets for automation tests with the selected tests and settings so that you can use them again at a later date. |


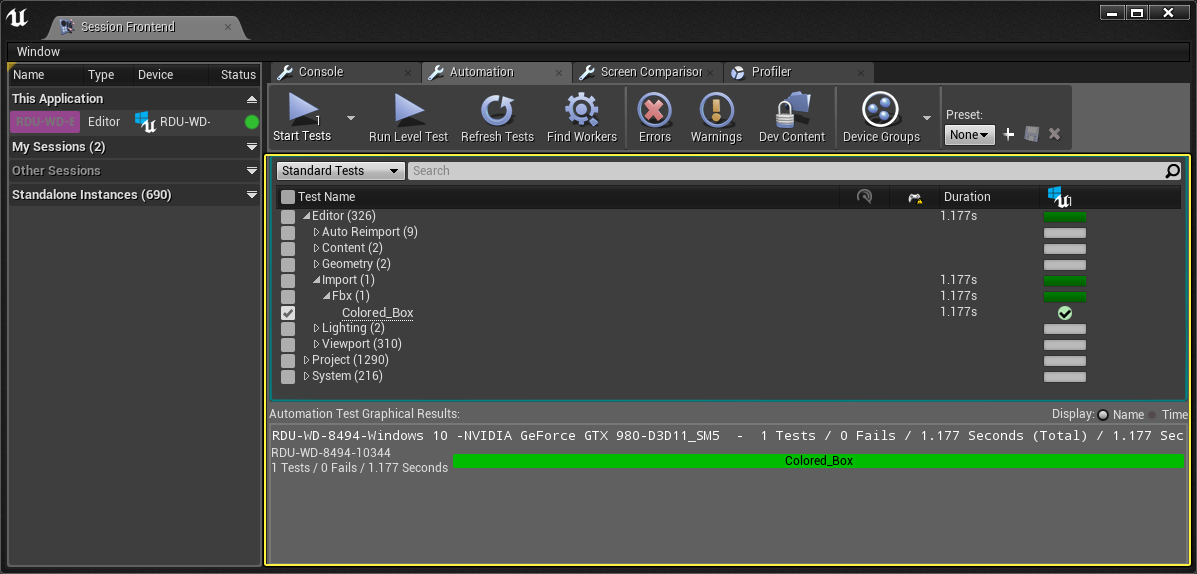
Tests Window and Results
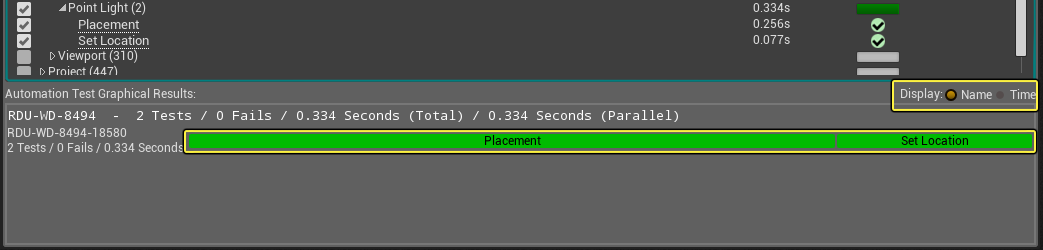
In the Automation Tests Window and the Automation Test Results panel, you'll find information relevant to the tests that have been run, such as the Machine that it was completed, number of tests that were run, the number of fails, and much more.
Click image for full view.
You can use the Device Groups button to determine how information should be grouped in the results panel when starting a new run of automation tests.

When looking at the results, use the Display selection to show the Name of the test or the Time the test took to complete.
Click image for full view.
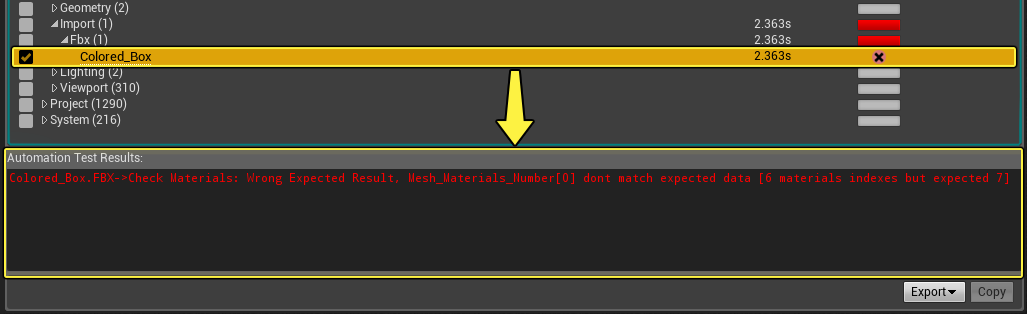
When you get an error or warning, you can click on the test from the main Test window to show the specific error / warning in the Results panel.
Click image for full view.
Export
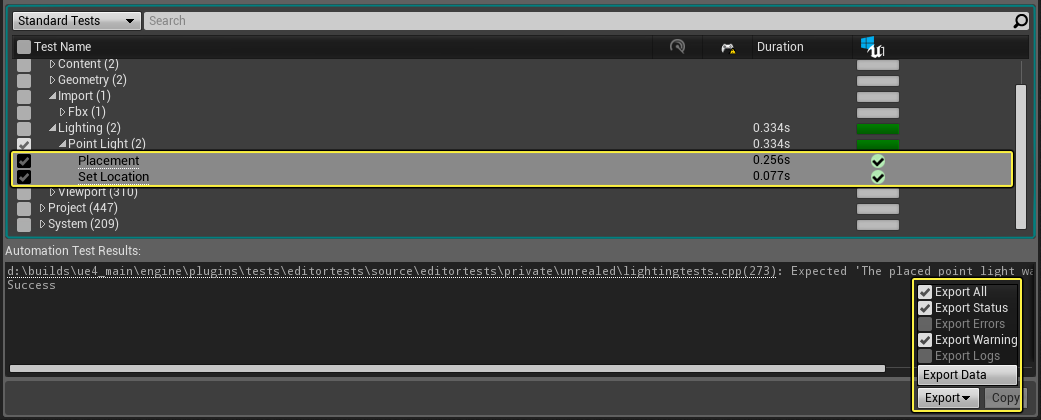
Once the tests have been completed, it is possible to export the results to a CSV file via the Export drop-down.
Click image for full view.
Choose from the available filters that you'd like to export and then select the Export Data button.

When your data is exported, a pop-up will indicate if it was successful and the save location of the CSV file.

The Export drop-down will only be active once reports have been generated, and the Export Data button will only become active if there are reports that meet the filter criteria.
Copy
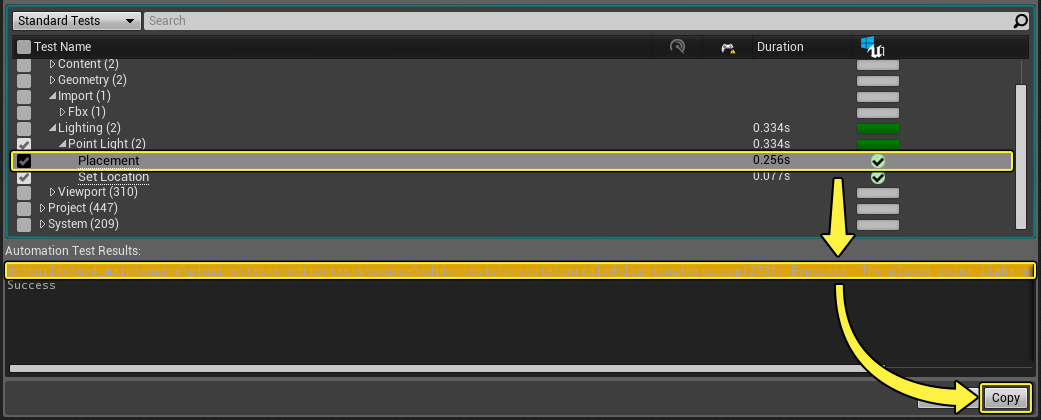
Once the tests have been completed, you can select any lines that appear in the Automation Test Results panel and click the Copy button to copy them to your clipboard and paste elsewhere.
Click image for full view.