Choose your operating system:
Windows
macOS
Linux
Unreal Insights helps developers identify bottlenecks, which is useful when optimizing for performance. At a high level, Unreal Insights is a stand-alone profiling system that integrates with Unreal Engine to collect, analyze, and visualize data emitted by the engine. In addition to providing robust coverage of the Engine's existing systems, Unreal Insights makes it easy to add your profiling data. Finally, the system features the capability to record data remotely, minimizing the application's impact on your project's execution.
Setup
The Unreal Insights tool ships with Unreal Engine, located in the
Engine/Binaries/Win64
directory. For users who download the UE4 source code and compile it locally, you can compile it either by building the entire UE4 solution in Development or Shipping mode or by building the "UnrealInsights" project directly.
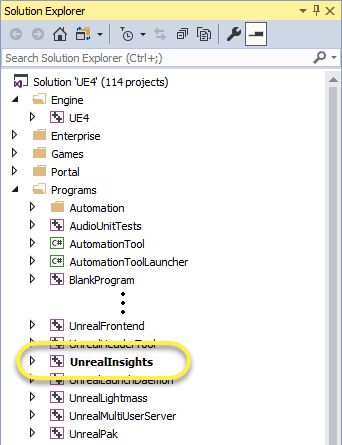
Once you have located or built the compiled program (
UnrealInsights.exe
), run it on the machine that you want to use to record your data or view your live session. To minimize the tool's impact on your application's performance, we recommend running the tool on a different machine than the project you need to monitor. It's still possible to run both the project and the tool on a single computer, though keep in mind that the tool must be running first because the project will attempt to connect to the tool as soon as it starts up.
If the tool is running remotely, provide its IP to the project by launching the project with the following command-line option, replacing "X" with the IP:
-tracehost=X
-
You only need the "-tracehost=X" argument when running on remote devices, Mac, and Linux.
-
When launching on Windows (and if it's discoverable), the runtime will automatically connect to Unreal Insights.
Tracing Runtime Events
The tracing of instrumentation events from a runtime to Unreal Insights is enabled using the
-trace[=channel0[,channel1...]]
command line argument. The argument takes an optional comma-separated list of trace channels to trace, or alternatively the name of a .ini-defined set of channels (more information below). If no argument is given to
-trace
a default set of channels is used (
cpu
,
frames
,
log
, and
bookmarks
). The resulting
.utrace
file appears in your project's default profiling directory (usually
/Saved/Profiling
). Unreal Insights can read the file; drag-and-drop it into the
Browser
pane to load it.
The
trace.stop
command pauses tracing on all channels; resume tracing by issuing another
trace.start
command. Because
trace.stop
applies to all channels, it does not take any arguments.
For information about profiling commands, read the Unreal Insights Reference .
Predefined sets of channels can be defined in .ini files under a
Trace.ChannelPresets
section. There is a default set (formerly named "Default") found in Engine/Config/BaseEngine.ini. This is the default used by
-trace
and
trace.start
. Users can easily add their own in an .ini file as follows.
[Trace.ChannelPresets]
MyChannelSet=log,frame
This preset can then be used via
-trace=MyChannelSet
or
trace.start MyChannelSet
.
For more information about the trace worker thread, read the reference information about Trace .
Unreal Insights — Browser
After starting the application in Browser mode (new in 4.25), it displays Trace Sessions (1), a Trace Store Directory (2) control, and a New Connection (3) menu.
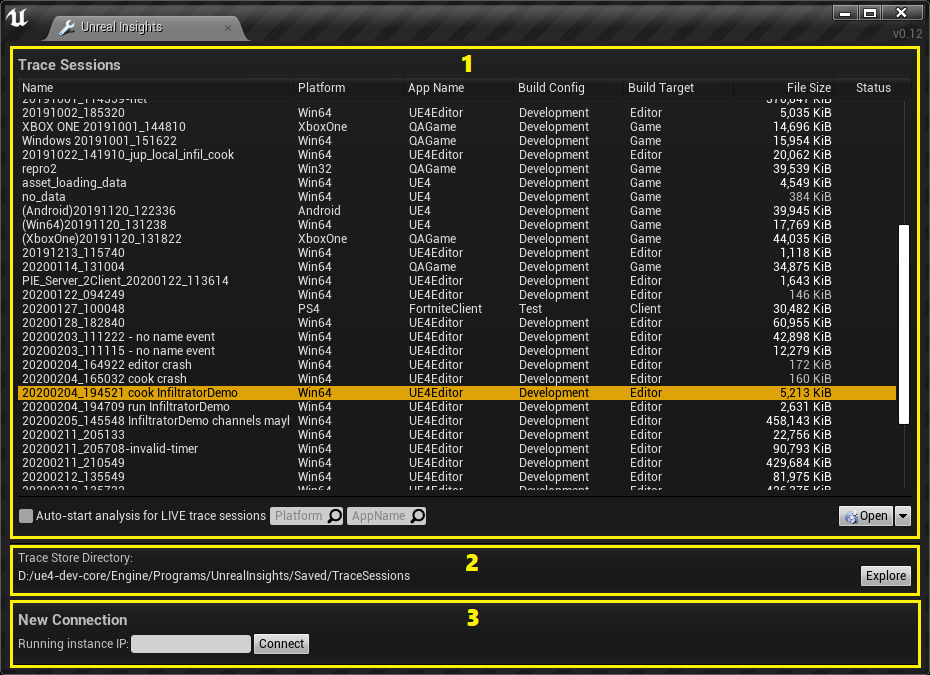
When the tool starts up, the Unreal Insights window opens first. In the top section of the window, labeled
Trace Sessions
, you will see a list of all pre-recorded sessions that you can load for analysis. These correspond to the
.utrace
files in your
Trace Store Directory
. You can double-click any of these trace sessions (or select a trace session and click
Open
), or you can search for
.utrace
files elsewhere with the
Open
dropdown arrow. To immediately start an analysis of a respective trace file, drag and drop a
.utrace
file from Explorer over the Unreal Insights window.
If a live UE4 session connects to the tool, it will also appear in the list. Live sessions have the word LIVE in the status column, and update in real time while you analyze them, but are otherwise identical to pre-recorded sessions. The tool can connect multiple sessions at the same time, and it will automatically record data for all of them as the data streams in. You can analyze these sessions in real-time by loading them from the list (just as you would with pre-recorded sessions).
The bottom section (
New Connection
) features an experimental
Connect
button and a text-entry field for users to enter the session IP that is already in progress. This is intended primarily for use with game consoles, but is still a work in progress and may not be reliable. Look for further iteration on this feature in future releases. At present, starting the Unreal Insights Tool before launching the project and using the
-tracehost=%ADDRESS%
command-line option for your project is the only recommended procedure.
Deprecated Functionality
Deprecated in 4.25, the Trace Recorder section included Stop button functionality to stop trace recording without closing the tool. This was useful for stopping the flow of new data into a live session after you collected the data you needed, but before the session ended, which could make it easier to read. Pressing this button also disconnected the tool from running sessions, and prevented new sessions from connecting.
While recording was stopped, Start appeared in place of Stop . Restarting recording enabled new remote Unreal Engine sessions to connect, but it wouldn't connect to any sessions that started while trace recording was stopped, and it wouldn't reconnect to sessions that were dropped by Stop .
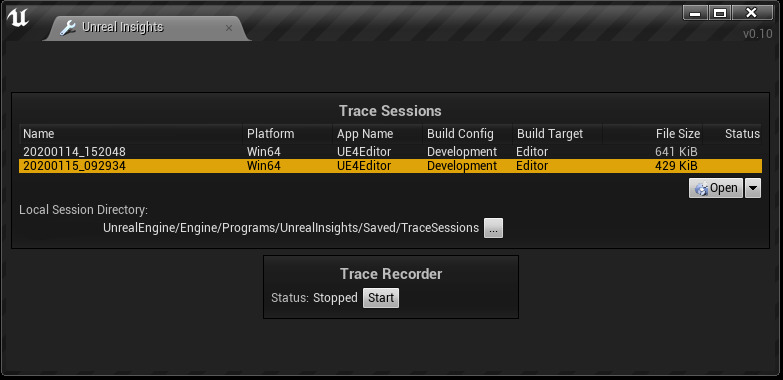
Unreal Insights v0.10 with Start button
Unreal Insights — Viewer
New in 4.25, trace session analysis starts in a separate process (Viewer mode). Additionally, multiple analysis (viewer) windows can be open at the same time.
After opening a trace session for analysis, Unreal Insights displays three window tabs. Two of the window tabs, including the
Timing Insights
window and the
Asset Loading Insights
window, browse and visualize performance data, and will appear after a session is ready for viewing.
Timing Insights Window
The Timing Insights window is where you'll see per-frame performance data for the CPU and GPU. There are several panels where you can look at different visualizations of the time your project spends on various tasks. You can select blocks of time to view in aggregate, sort or categorize data, and review log output. You can show or hide the respective panels.
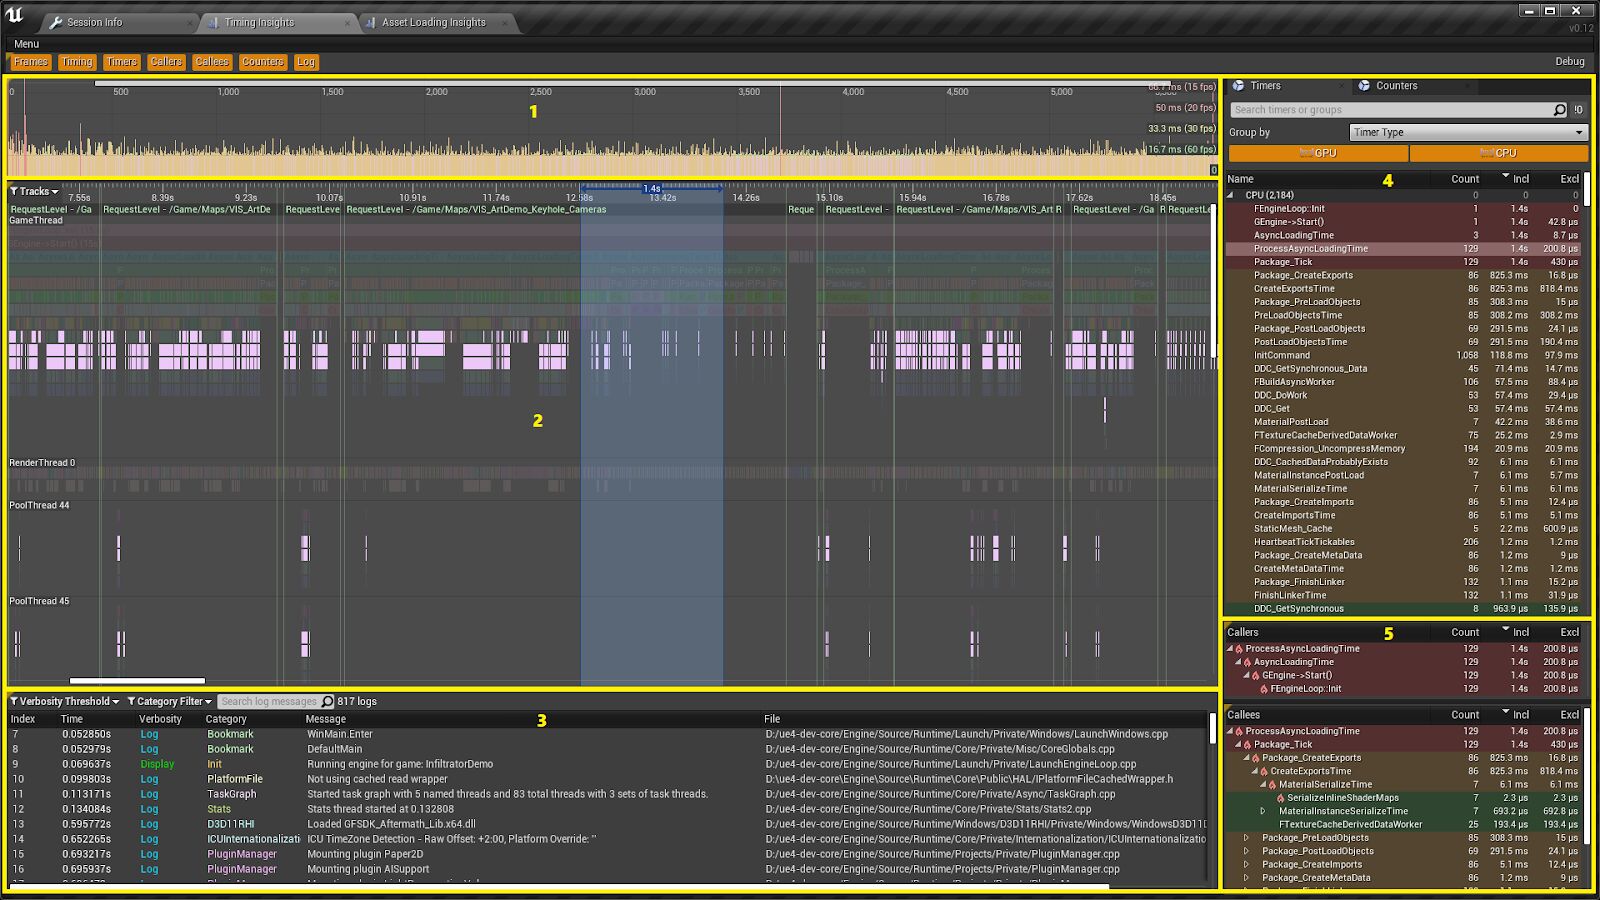
The Timing Insights window features the Frames panel (1), the Timing panel (2), the Log panel (3), the Timers and Counters tabs (4), and the Callers and Callees panels (5).
A key feature of the Timing Insights window is the ability to select a single frame or period of time and show performance information collected during that time by highlighting and zooming the Timing panel, and aggregating data in the Timers tab and Stats Counters tab. To do this, you can click on a single frame in the Frames panel, or click and drag a section of the scrub bar at the top of the Timing panel, known as the Time Ruler .
!0
Frames Panel
The Frames panel shows the total time taken by each frame, using a bar graph format. This is good for identifying general trends, such as the framerate lowering when a certain level is loaded or an unoptimized scene is visible, or discovering the reason for an individual frame being slow, such as spawning a large number of Actors all at once. Since taller bars represent longer frames, it's easy to pick out the exact moment when these events happen, and examine the data to see which operations are responsible. Hovering the cursor over a bar causes that frame's index and running time to appear. If you then left-click the bar, you can isolate data for that frame in the Timing panel, Timers tab, and Stats Counters tab.

A selected frame within the Frames panel. The white bracket marker shows the set of frames visible within the Timing panel.
Timing Panel
The bulk of your time in Unreal Insights will be spent on the Timing panel. This panel shows a visual representation of each instance of every timer event that has run during a session. Unlike the Frames panel, which provides an overview of whole frames, the Timing panel shows individual trace events and provides time measurements with sub-microsecond precision. These events stack vertically to indicate the scope and use separate tracks to show activity on different threads. Within the track display, events are broken out by thread, divided vertically to show scope, and positioned horizontally based on their start and end times.
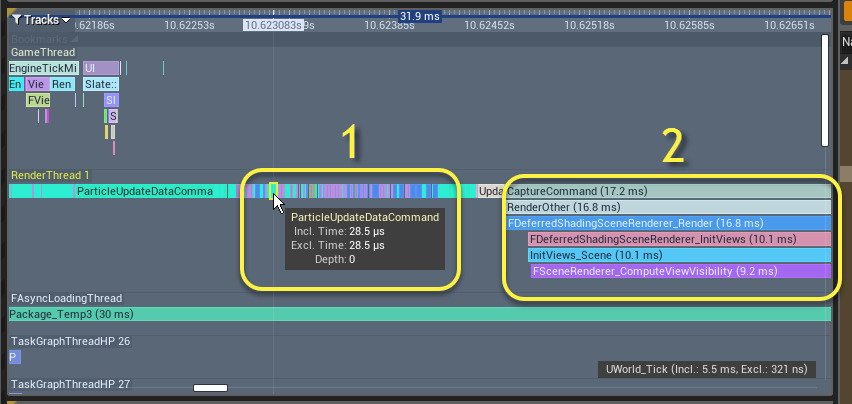
The tooltip that appears when hovering over a timer event within the Timing panel. (1) A stack of nested events on the same thread. (2)
You can turn groups of related threads on or off in the Tracks dropdown in the upper-left corner of the panel. Hovering the mouse cursor over a block in any track reveals information about that timer event, and clicking on it locates and selects the event in the Timers tab.
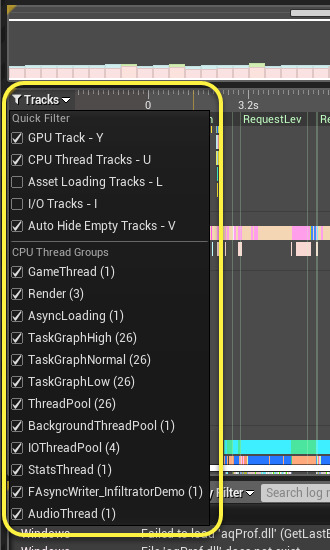
The Timing panel features a dropdown menu to hide or show groups of tracks based on what threads they contain.
When working with the Timing panel, you may want to see aggregate data for a specific time range. Click and drag the mouse pointer across the Time Ruler to select the period you want to examine. You can also use Ctrl + double-click on an event in the Timing tab, or left-click a Timing event to select it then press the Enter key. Another option is to click the frame in the Frames panel. When you do this, the selected time range appears as a blue overlay with its total length shown at the top, and the Timer tab and Counter tab show only the data that falls within that time range. You can then press F to zoom and pan directly to the selected time range.
Available in 4.25, to highlight (filter) all timing events of the same type (timer), double-click the timing event in the Timing View.
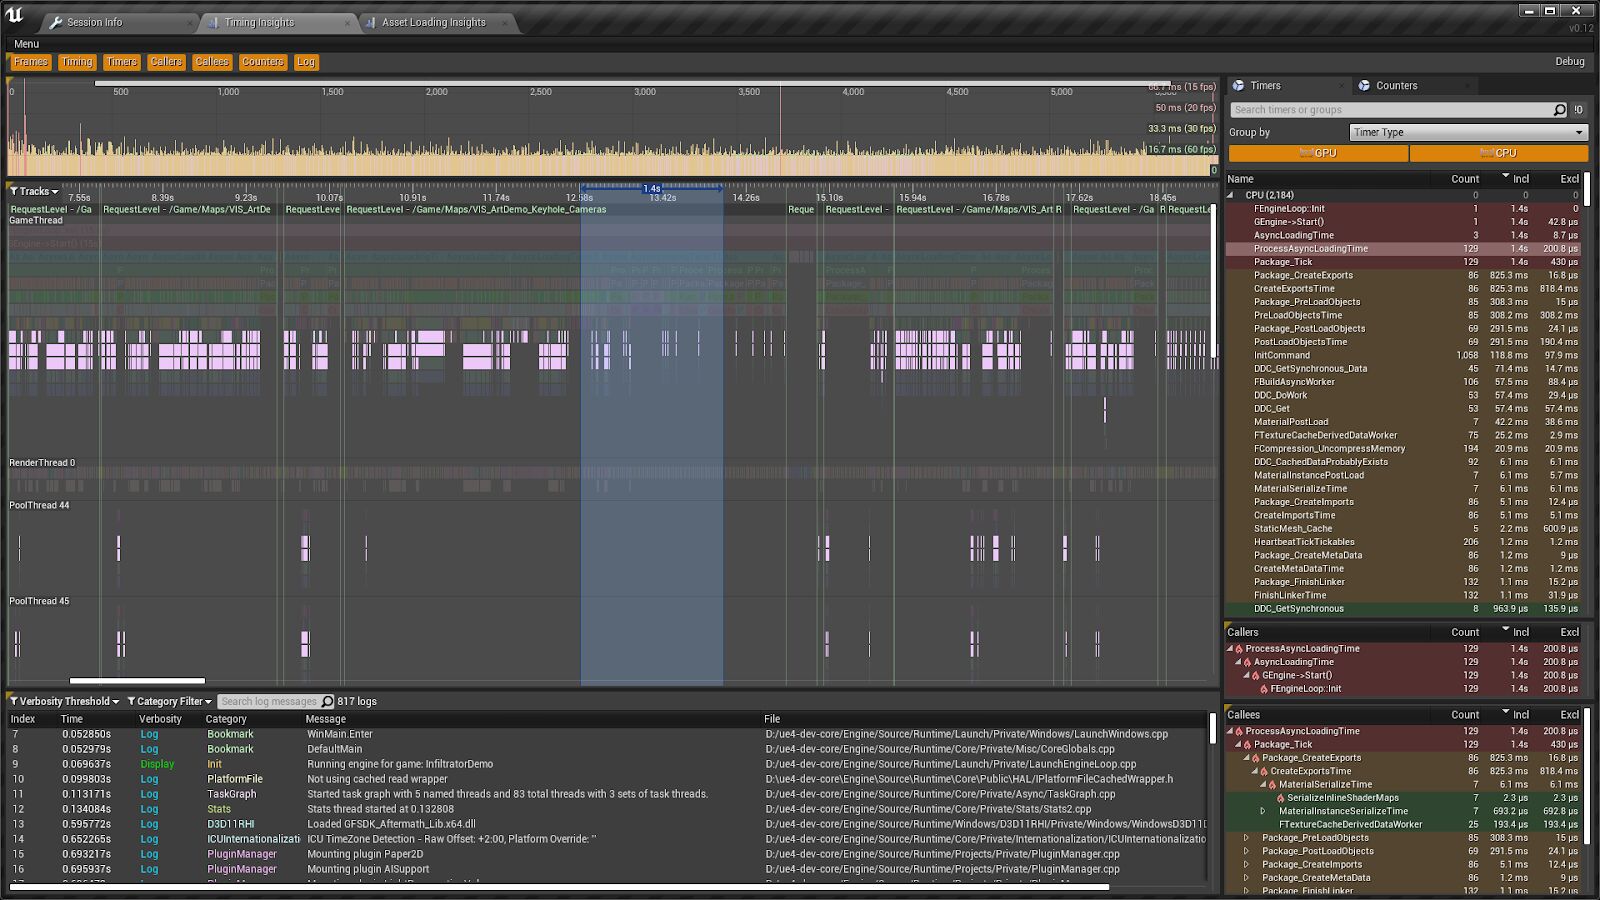
Similar timing events highlight while all other timing events display with faded colors
Timers Tab
The Timers tab lists all timer events that have run within the time range designated in the Timing panel. In addition to aggregating data based on time range, this list can be sorted in ascending or descending order by the values in any active column. To change sort order, or to activate or deactivate columns, right-click anywhere in the list. The following columns are available for the Timers tab:
-
Meta Group Name
-
Type
-
Instance Count
-
Total Inclusive Time
-
Max Inclusive Time (ms)
-
Average Inclusive Time (ms)
-
Median Inclusive Time (ms)
-
Min Inclusive Time (ms)
-
Total Exclusive Time
-
Max Exclusive Time (ms)
-
Average Exclusive Time (ms)
-
Median Exclusive Time (ms)
-
Min Exclusive Time (ms)
Group By
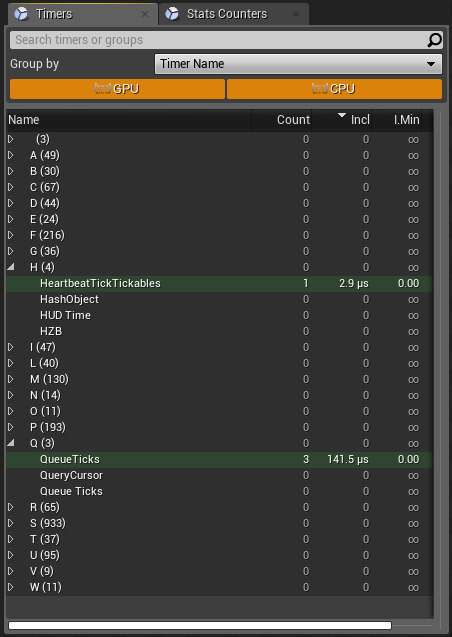
Timers tab data grouped by Timer Name
Counters Tab
The Counters tab lists all stats that were incremented during the same period as the Timers tab. Users can update sort order and column organization in the same way as the Timers tab. The following columns are available for the Counters tab:
-
Meta Group Name
-
Type
-
Count
-
Sum
-
Maximum
-
Upper Quartile (not implemented in 4.23)
-
Average
-
Median
-
Lower Quartile (not implemented in 4.23)
-
Minimum
Group By

Counters tab data grouped Flat
To turn on Graph track visibility when adding a graph series for a counter, double-click the counter.
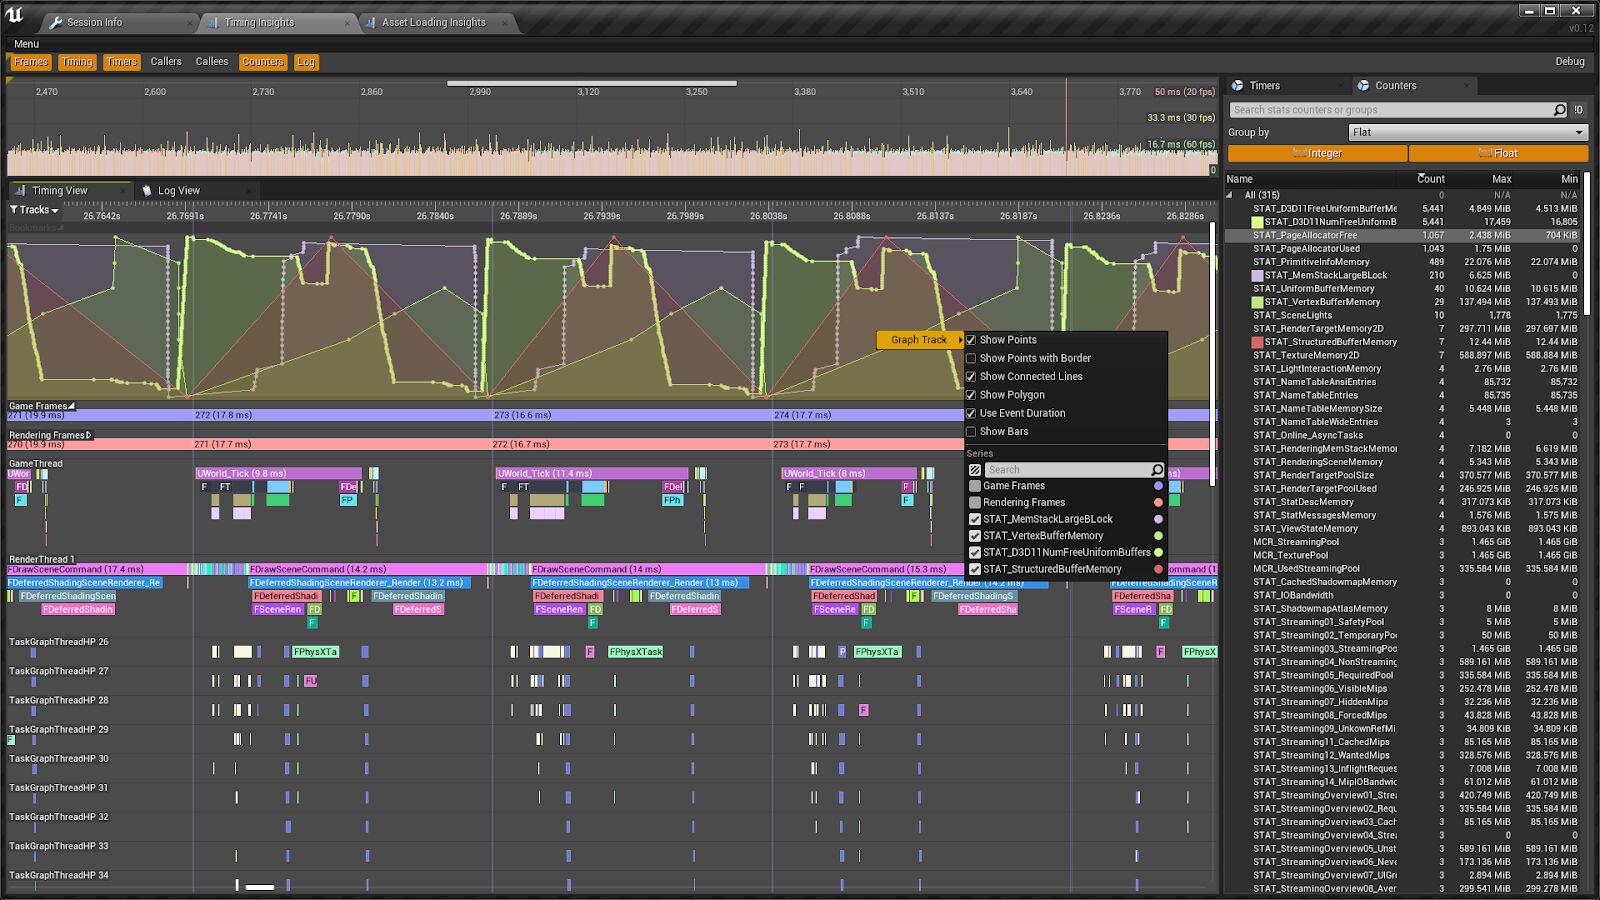
STAT_PageAllocatorTree Graph Track
Log Panel
The Log panel displays all logs (generated by
UE_LOG
calls) from the UE4 session. The logs can be filtered by verbosity and category, just as in the Output Log window in the Editor. It also features a search box that filters out all log messages that don't match the text you enter. In addition to filtering, clicking any row pans the Timing panel to the time when that row's text was logged.

Selecting a time period in the Timing panel highlights all log entries that fall within that time (in blue). Conversely, if you select multiple log entries, by clicking one entry and then shift-clicking another, the Timing panel highlights the time range between those entries.
Asset Loading Insights Window
To analyze Asset loading performance, the Unreal Insights Tool features the Asset Loading Insights window. This window contains a specialized version of the Timing panel from the Timing Insights view that has been configured to focus on events related to loading Assets.
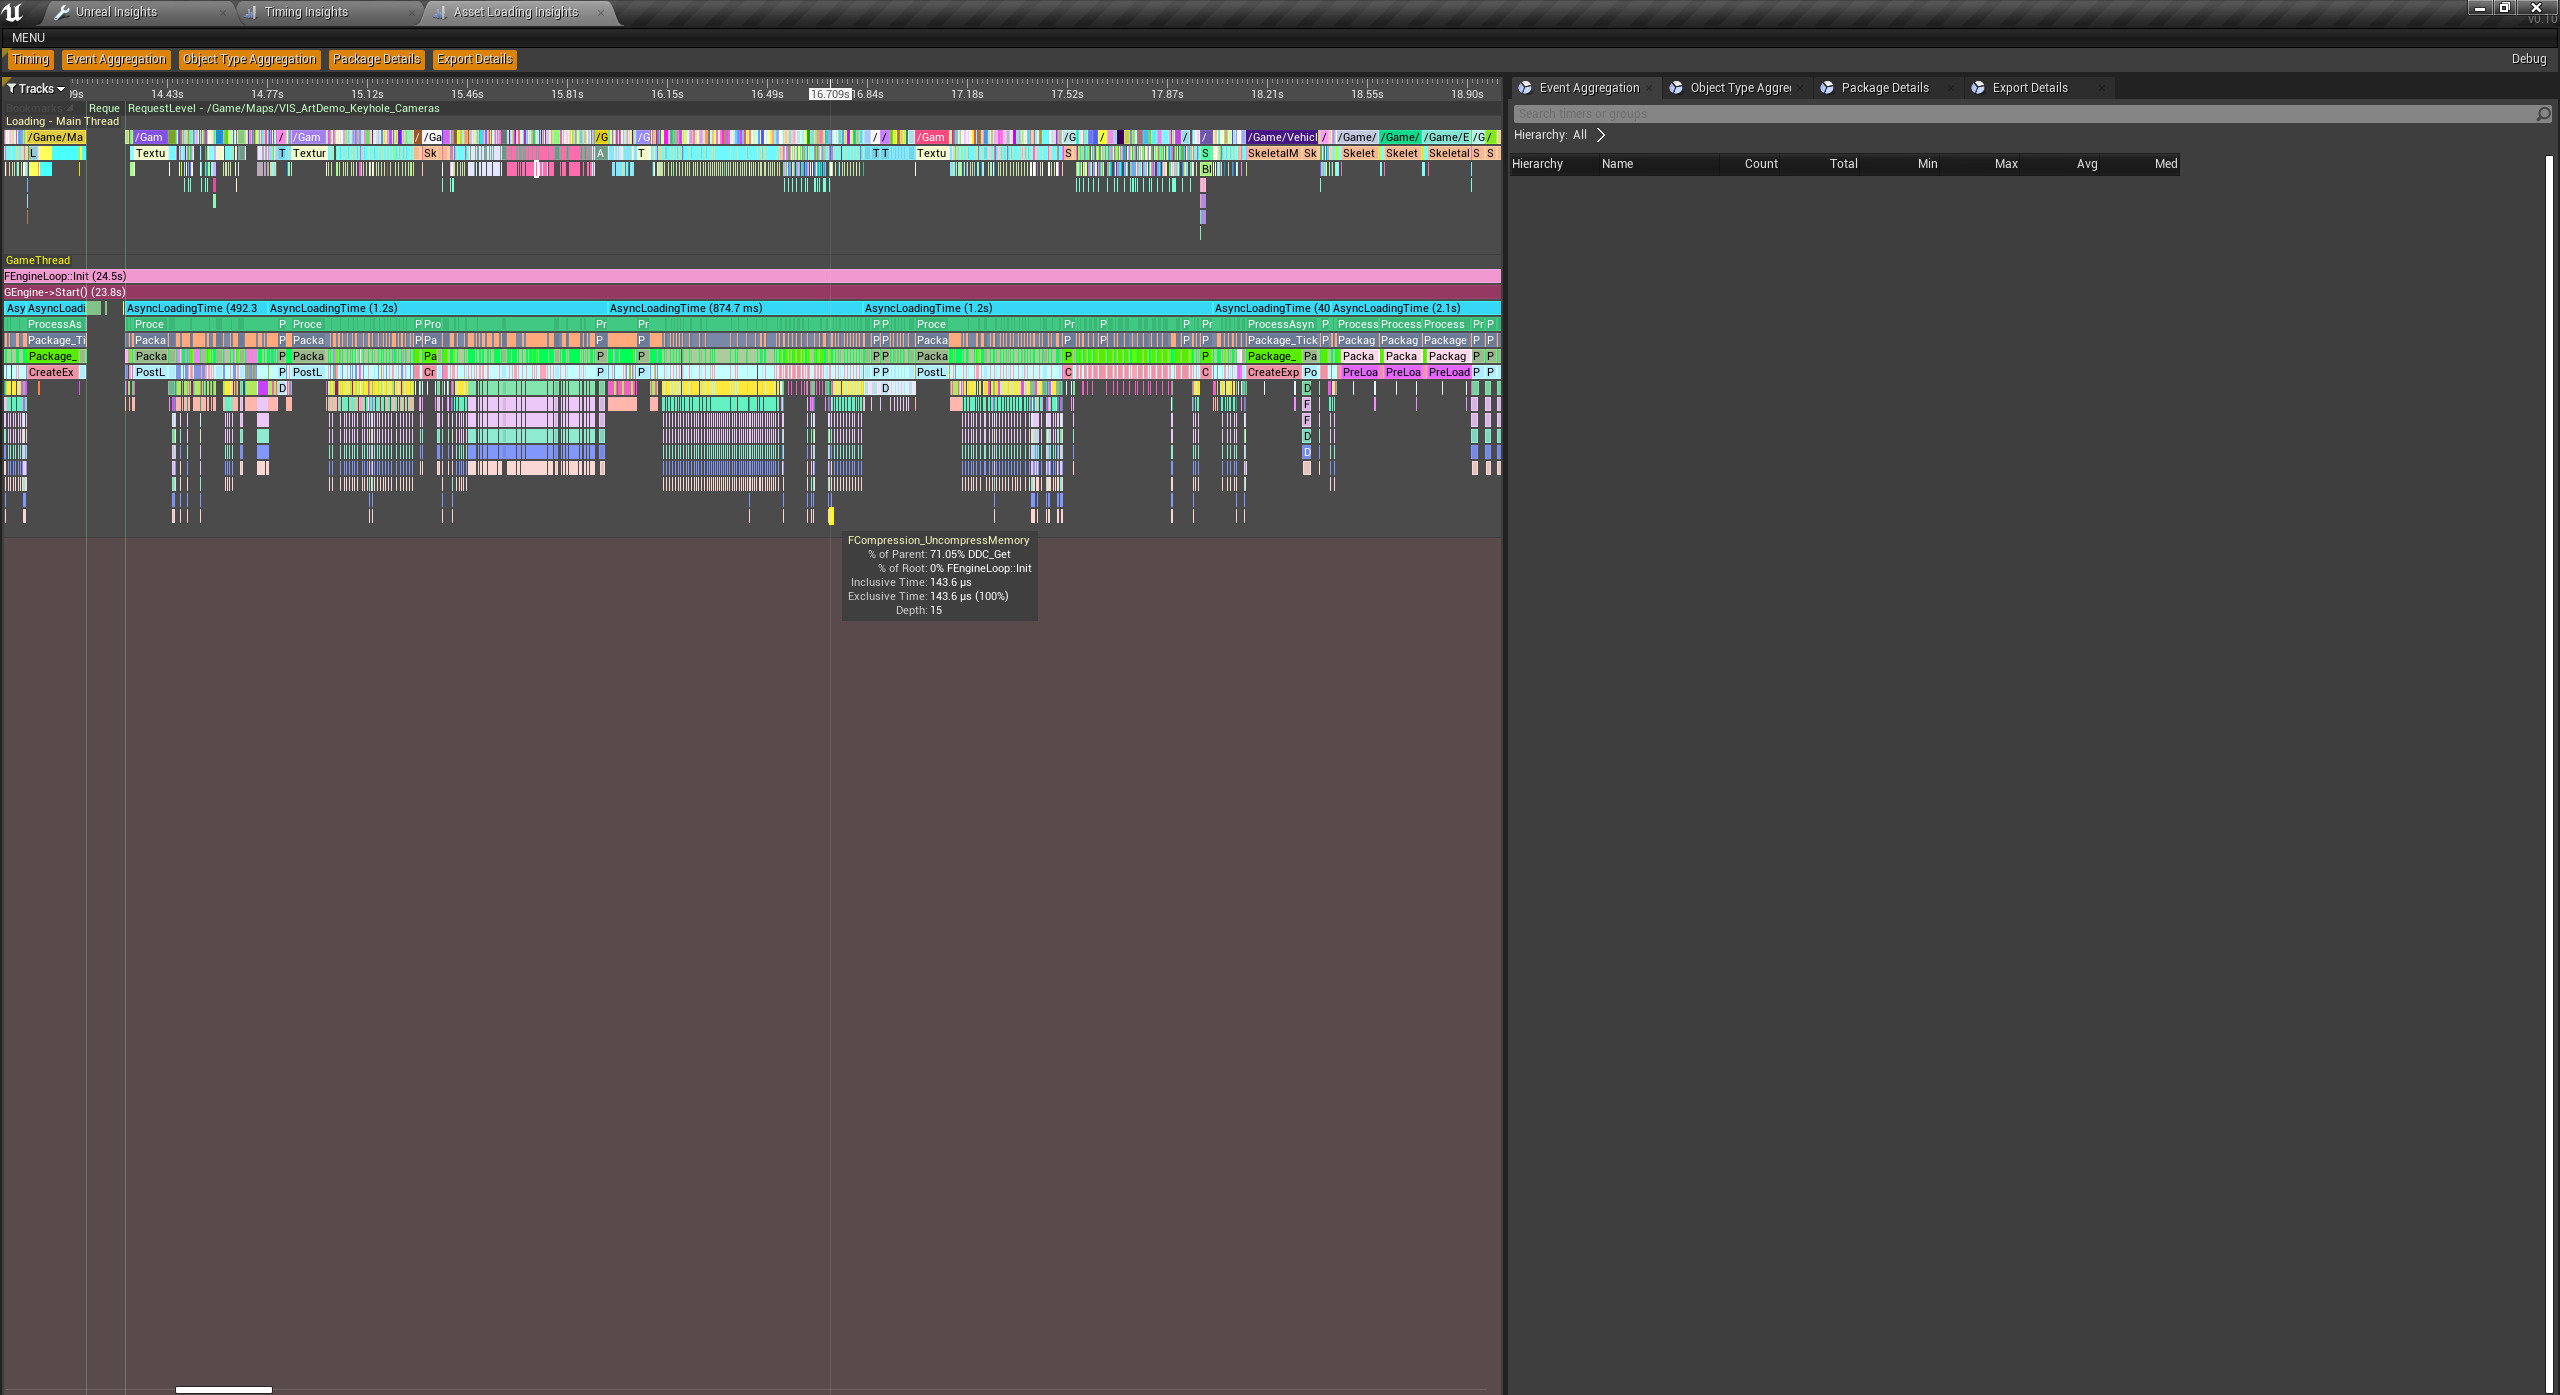
-loadtimetrace
Memory Insights Window
Memory Insights gives developers visibility into how their applications use memory. Visibility into memory usage enables teams to better understand how their work impacts application performance and engine behavior.
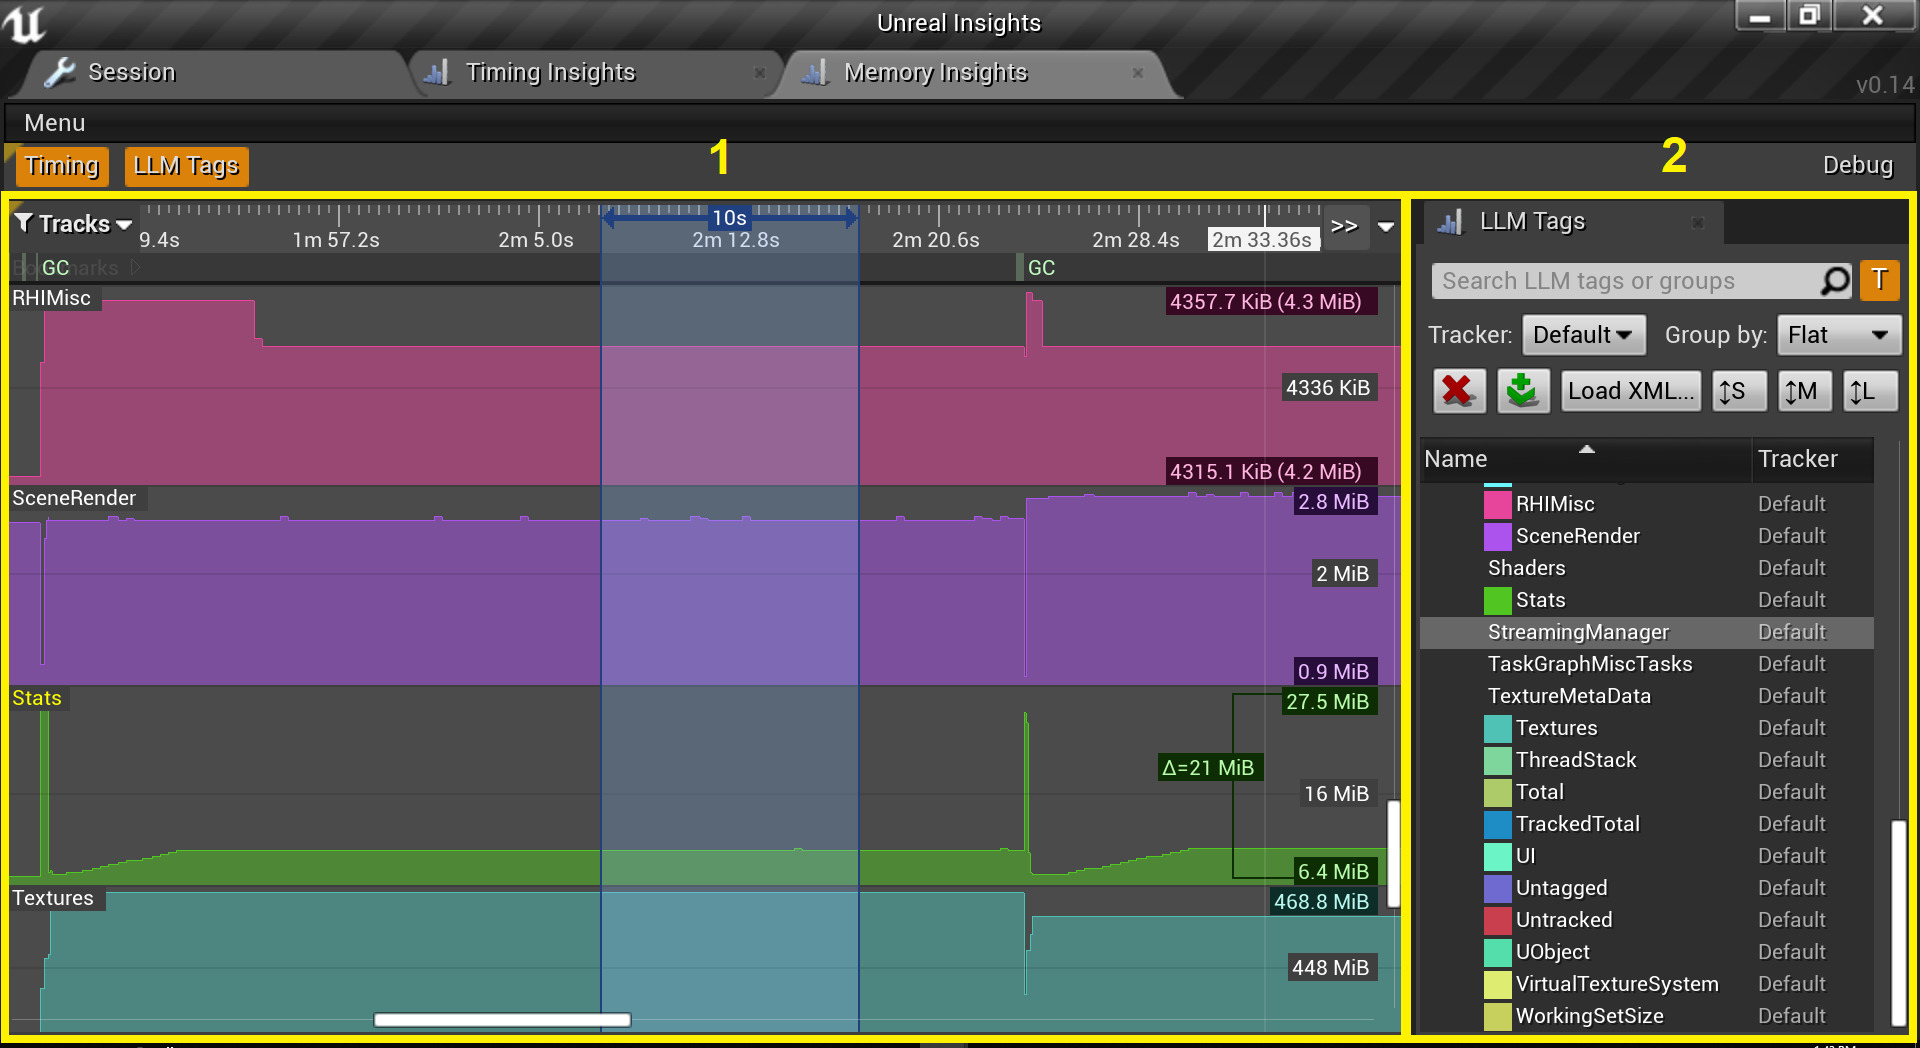
Memory Graph panel (1) and LLM Tags panel (2)
The following default graph tracks display memory usage.
-
Total
-
TrackedTotal
-
Untracked
-
Meshes
-
Textures
-
Physics
-
Audio
Usage
To trace an application's memory usage, enter
-trace=memory
into the
Additional Launch Parameters
text box under
Level Editor
-
Play
>
Play in Standalone Game
.
-trace=memory
implies
-llm
Memory Graph Panel
The LLM Graphs Panel displays memory variation for the respective LLM Tag over time. The Memory Graph panel features a custom vertical axis grid that includes minimum and maximum values in the visible range. While hovering the mouse cursor over the right side of a track, a delta value will display between the current minimum and maximum values as long as those values are not equal to each other.
LLM Tags Panel
The LLM Tags panel displays the list of available LLM tags. Every LLM tag in the list has the following attributes.
|
Attribute |
Description |
|---|---|
|
Color |
The color displays if there is a memory graph track for the LLM tag. |
|
Name |
This is the LLM tag's name. |
|
Tracker |
Identifies which tracker(s) use the LLM tag. |
Users can double click on an LLM tag to add or remove its Memory Graph track. Also, users can sort and group the LLM Tag list per tracker.
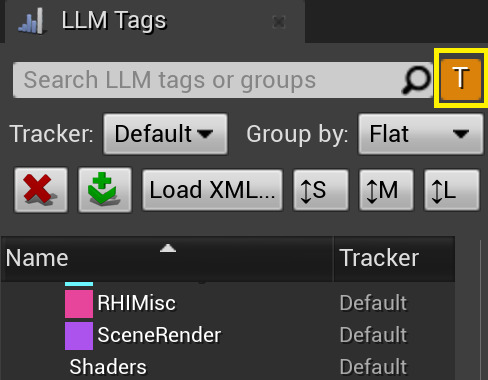
When enabled, the toggle filters the LLM Tags in use by the current tracker.
Channels
Channels is a new concept that provides a way for developers to categorize events into named groups. This allows developers to manage the amount of generated trace data, resulting in performance and space savings. Currently, channels are disabled by default, but you can toggle them on or off during live sessions.
To enable the
Insights Data Source Filters
and
Trace Data Filtering
plugins from inside the editor, locate them in
Editor > Plugins > Built-In
. Otherwise, enable the plugin in the project's
*.uproject
file:
{
    "FileVersion": 3,
    "EngineAssociation": "4.25",
    "Category": "",
    "Description": "",
    "Plugins": [
        {
            "Name": "TraceSourceFilters",
            "Enabled": true
        },
        {
            "Name": "TraceDataFilters",
            "Enabled": true
        }
    ]
} Customizing Your Project's Output
By making some minor changes to engine, plugin, or project source code, you can activate or deactivate certain Unreal Insights features. You can also add custom logging.
Activating or Deactivating Logging
If you want to exercise control over which areas send logging data, or if you simply want to deactivate the entire system, you can do this by editing the engine's source code and changing the values of certain macros. These macros are spread across the engine, generally in header files for the relevant features or modules. They use the value "1" for areas that have logging turned on, and "0" where it's off, but are always defined within a conditional structure that first determines whether or not the macro is appropriate within the context of the build.
LOGTRACE_ENABLED
is the macro that controls log message tracing, residing in
Engine/Source/Runtime/Core/Public/Logging/LogTrace.h
within the following structure:
#if !IS_PROGRAM && !UE_BUILD_SHIPPING && (PLATFORM_WINDOWS || PLATFORM_PS4 || PLATFORM_XBOXONE)
#define LOGTRACE_ENABLED 1
#else
#define LOGTRACE_ENABLED 0
#endif
By default,
LOGTRACE_ENABLED
is defined as "1" in builds where it is appropriate to send log data to the Unreal Insights system. To deactivate it, the second line in the code (above) would be changed so that
LOGTRACE_ENABLED
is defined as "0" rather than "1".
Adding Custom CPU Scope Timers
To add logging to your own engine features, plugins, or projects, invoke the
TRACE_CPUPROFILER_EVENT_SCOPE
macro at the scope that you wish to profile. This macro takes a single text argument to identify the trace group that will own the profiling data it generates. You can use any name you like, but common examples might look like
TRACE_CPUPROFILER_EVENT_SCOPE(TEXT("MyClass::Function"))
or
TRACE_CPUPROFILER_EVENT_SCOPE(TEXT("ReticulatingSplines"))
. Remember that the
TRACE_BOOKMARK
and
UE_LOG
macros show up in Unreal Insights, so putting logs near areas of the code that you want to investigate could help you to find the information you need faster when analyzing data.
Insights Log
The Insights Log displays message logs that are specific to Unreal Insights. In the following example, Insights Log displays warnings and errors from parsing LLM XML report files.

Platform Details
With Unreal Insights, it is possible to collect trace data on a few platforms, such as Android and PC.
Android
Using Android Debug Bridge (adb), Android tools can redirect TCP traffic over a USB cable. To connect a runtime application on an Android device, first, instruct adb to pass through TCP connections made on the device over USB:
adb.exe reverse tcp:1980 tcp:1980
Unreal Insights listens on TCP port 1980.
When running on the device, it should connect to
localhost
, such that the operating system will route traffic across the USB cable.
-tracehost=127.0.0.1You can use these CLI arguments in an Android project in one of two ways.
First, you can add
-tracehost=127.0.0.1
to an empty text file named
UE4CommandLine.txt
. Then, run
adb push <path_to>\UE4CommandLine.txt /mnt/sdcard/UE4Game/<project_name>/UE4CommandLine.txt
.
Or, you can run
adb shell setprop debug.ue4.commandline -tracehost=127.0.01
. This wil only persist as long as the device is turned on.
Using the command
adb shell setprop debug.ue4.commandline \"\"
will remove command line arguments.
Either of these methods will add the command line arguments to the application on your device. After that, you can run the application normally, or run the app using
adb shell am start -n com.<your_company_name>.<project_name>/com.epicgames.ue4.GameActivity
.
Files
Trace can output to a file using the
-tracefile=PATH
command line argument. The value of
PATH
is specific to the platform being traced, including PC and Android.
PC
-tracefile=d:/foo/bar.utraceAndroid
-tracefile=/sdcard/UE4Game/foobar.utrace
/sdcard/