Choose your operating system:
Windows
macOS
Linux
In many ways, profiling a project that uses stereo rendering is the same as profiling any real-time rendering project, but there are a few areas that require special attention.
What is the Same?
The usual process applies here: find the bottleneck, then choose the appropriate profiling tool.
In general, the first step is to use the stat unit console command to see what thread has the highest number:

|
Name |
Description |
|---|---|
|
Frame |
Frame time is the total amount of time spent generating one frame of the game. Since both the Game and Draw threads sync up before finishing a frame, Frame time is often close to the time being shown in one of these threads. |
|
Game |
If Frame time is close to Game time, the game's performance is likely being bottlenecked (negatively impacted) by the game thread. |
|
Draw |
If Frame time is close to Draw time, the game's performance is likely being bottlenecked by the rendering thread. |
|
GPU |
GPU time measures how long the video card takes to render the scene. Since GPU time is synced to the frame, it will likely be similar to Frame time. |
|
RHIT |
Typically, RHI Thread time is synced to the frame, and it will likely be similar to Frame time. |
|
DynRes |
If supported (and enabled), DynRes shows Primary Screen Percentage by Secondary Screen Percentage. |
-
When Game time is high, a sampling CPU profiler such as Unreal Insights should be used.
-
When GPU time is high, the methods of traditional GPU Profiling generally apply.
-
When Draw time is high, draw call count may need to be reduced. See the Asset Reduction Tools and Optimization Tips presentation on unrealengine.com/resources for information about how to address this by merging Static Meshes with the Actor Merge Tool , and by using HLODs .
Build Configuration
When profiling, it is important to profile a "Test" build configuration . This is the closest option for performance that is representative of the final shipping version of the project, but that still has some limited debugging and profiling capabilities.
VSync
When trying to profile the GPU, VSync is often problematic and should always be disabled. It can insert wait time in arbitrary places and can be misleading when looking to see where the slowest code is.
It also means that missing the target frame time by a small amount will cause the frame rate to be cut in half, to ensure there is no vertical tearing. This is often misinterpreted as a huge performance issue, when in reality it was a tiny change that pushed the frame rate over the VSync limit, and is probably easily addressable with some profiling and targeted project-side optimizations.
What is Different?
Compositors
Head-mounted display systems that use stereo rendering generally have a compositor. The compositor takes the final frame rendered by the application (in this case Unreal Engine) and applies a distortion opposite to that of the optical lenses in the headset to make the image look correct. The compositor optionally can do some additional work to smooth over frame hitches or low frame rates by inserting interpolated frames as well as other tasks.
These tasks take time. It is common for a compositor to take up to 1 millisecond to do this work, which means there is one less millisecond per frame for an application to use. This must be taken into account when budgeting frame time for a project. As always, average frame time should be lower than 1 second divided by the number of frames (minus 1 for the compositor), to account for occasional hitches. Alternatively, dynamic resolution can be used to scale resolution down to meet frame time budgets in heavy scenes, or up to use the full GPU time when available.
Compositor-Forced VSync
The issues mentioned above around VSync are true for non-stereo rendering as well, but with stereo rendering these issues are exacerbated by higher resolution and rendering once for each eye. Furthermore, most compositors force VSync to always be on. This means that there is no way to be sure GPU timings in the headset are accurate. The solution for this in Unreal Engine is to launch with the
-emulatestereo
command line parameter to perform stereo rendering to the monitor screen without involving the compositor, allowing VSync to be disabled.
Latency
While not strictly a performance problem, latency is very important for a comfortable XR experience.
A simple pipeline will just sequentially simulate the current frame and then render it.
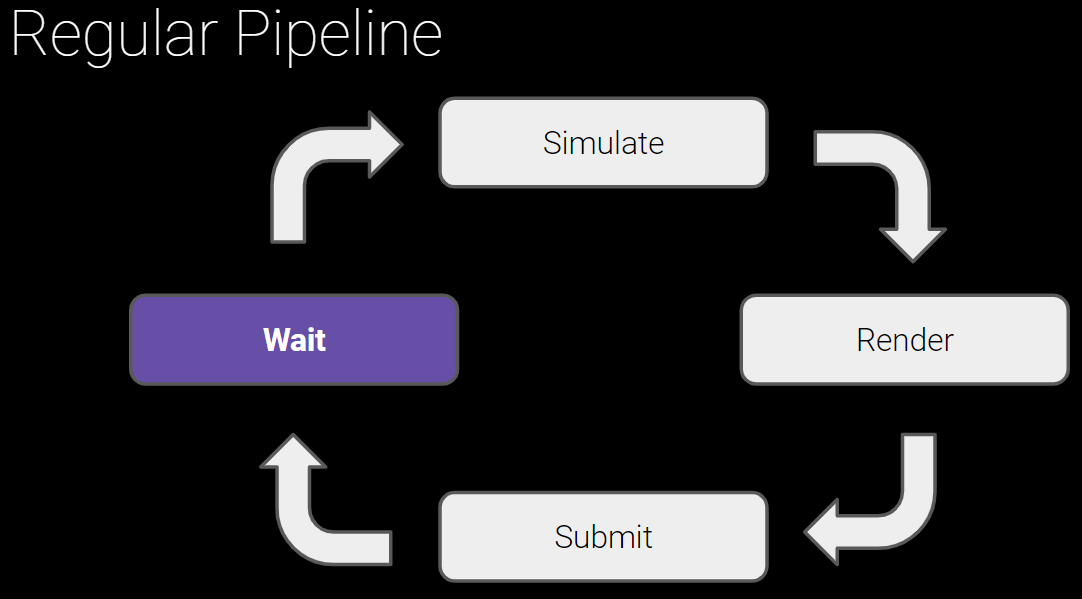
Click image to expand.
In that simple method, because rendering waits for the simulation to complete, you have a tight budget since everything needs to be completed in 11ms.
Instead, you can let the simulation run slightly ahead of rendering. In Unreal Engine 4, this is running on the Game Thread . The wait happens on that game thread, before the next frame's simulation. The rendering and submit happen on a seperate thread (the Render Thread ).
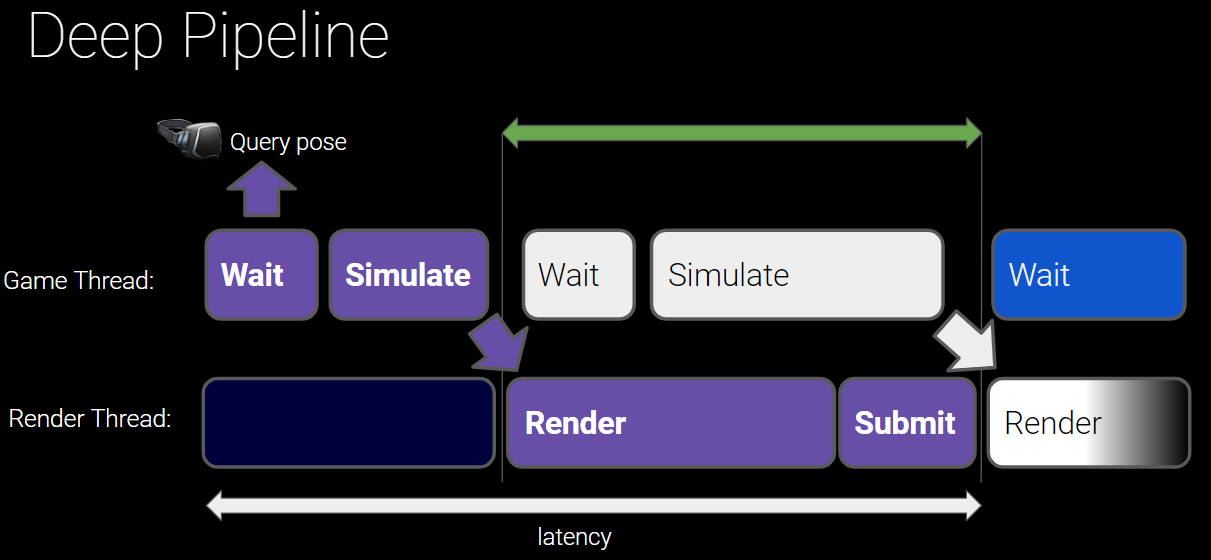
Click image to expand.
But, if you naively query the pose at the beginning of the simulation and use that pose for rendering, the head-mounted display can feel laggy or slow, because now there's potentially two frames of time between querying the device position, and displaying the resulting frame.
This can be resolved by querying the pose again before rendering, and using that updated pose for calculating transforms for rendering.
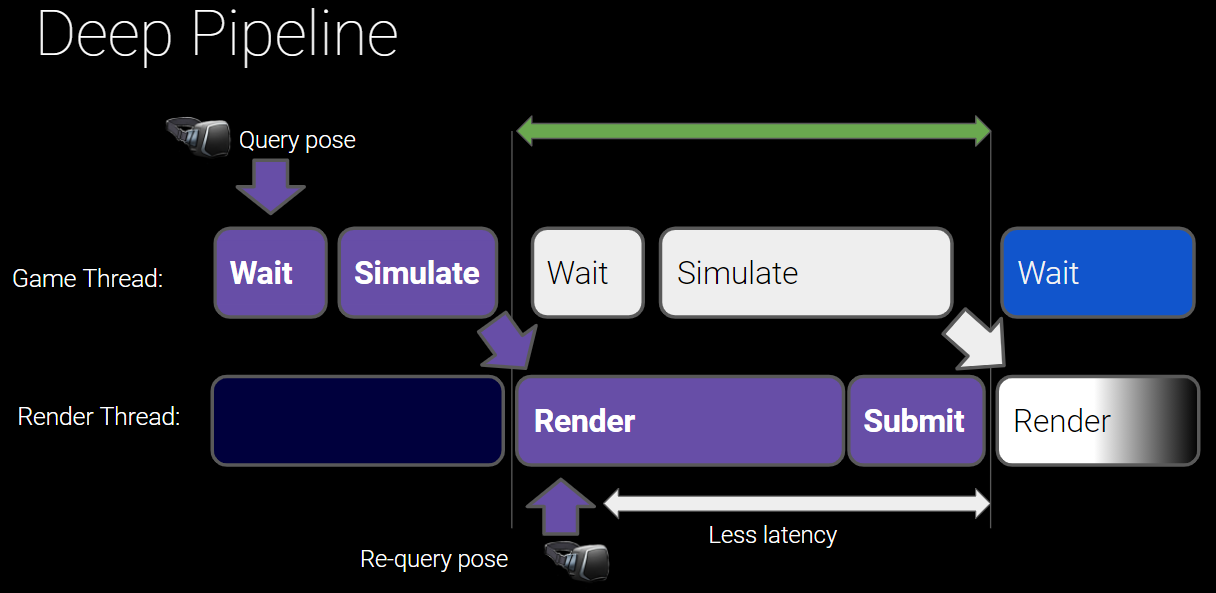
Click image to expand.
There are a few booleans for controlling this behavior. The camera being used for the HMD view in your scene needs to have Lock to HMD enabled. Disabling this will disable late updates and increase latency. Motion controllers also have a late update checkbox. If the application feels like it is not as responsive as desired despite hitting the target frame rate, it would be worth checking to make sure these late update settings are enabled.
Additional Timing Considerations
In addition to VSync, there are other considerations for stereo rendering head-mounted displays that make consistent timing even more important, and that make it extra susceptible to hitches. The rendering is highly dependent on accurate, timely tracking information for the movement of the head-mounted display and (to a lesser degree) any other tracked devices like motion controllers.
Because polling the tracking positional data for the HMD and rendering the frame based on that positional data need to happen in quick succession, if the rendering thread falls too far behind the game thread that is polling the positional data, the game thread will wait for the rendering thread to catch up. This means that if the scene is GPU intensive, it can even cause the CPU to wait as well. Sometimes, this can be misinterpreted as logic on the CPU being slow (in a similar way to how VSync can sometimes be misinterpreted as GPU logic being slow).
Additionally, because of the timing interdependency of the GPU on the CPU and vice versa, and because the CPU may be working on the next frame while the GPU is rendering the last, a slow down on one frame may cause a cascade of delays that can take multiple frames to recover from. It can be hard to track down the cause of frame 3 slowing down when it started with a slowdown on frame 1, and so on.