Choose your operating system:
Windows
macOS
Linux
Unreal Engine can ingest a variety of data types from multiple sources at the same time. For example, in Virtual Production, the engine can receive captured frames from the camera on SDI as well as the position and orientation of the camera from the tracking system through Live Link. The Timed Data Monitor is a solution to configure and visualize how all this incoming timed data relates to each other and the engine's time.
The Timed Data Monitor currently supports sources from:
You can extend the functionality of Timed Data Monitor to include other timed data sources through code. Use the TimedDataSource framework to register your custom data source with Timed Data Monitor.
The sections below cover how to use the Timed Data Monitor and the settings you can modify for your project.
Getting Started with Timed Data Monitor
Follow these steps to use the Timed Data Monitor with your project.
-
In the Editor's main menu, choose Edit > Plugins to open the Plugins window.
-
In the Plugins window, find the Timed Data Monitor plugin in the Virtual Production section.
![image alt text]()
-
Check the Enabled box.
-
In the popup, choose Yes .
![image alt text]()
-
Restart the Editor when prompted.
![image alt text]()
-
In the Editor's main menu, choose Window > Developer Tools > Timed Data Monitor to open the Timed Data Monitor window.
![image alt text]()


Timecode and Genlock
At the top of the Timed Data Monitor, you can view the CustomTimestep and TimecodeProvider used in the project. Without needing to switch to another window, you can also configure an offset for the TimecodeProvider.

For SDI inputs, these settings are changing the settings of the opened stream. It's not changing the actual MediaSource asset that was used when opening the input. If you find a good set of options, consider changing the associated asset.
Sources and Channels
Once the Timed Data Monitor plugin is enabled in Unreal Engine, any Live Link, SDI, or custom sources using the TimedDataSource framework in the project will automatically appear in the tool. Each source can contain multiple channels that are viewable by clicking the arrow in front of the source name. The table below describes the information represented in the UI for each source.
|
Column |
Description |
|---|---|
|
Enable / Disable Toggle |
When enabled, the channel will be included during calibration and will affect the global status reported in the monitor. |
|
Source Name |
To the left of the source's name are the following UI items:
|
|
Last Sample Time |
Timecode of the latest sample. |
|
Eval. |
Specifies how the input is evaluated. Evaluation types include:
|
|
Time Correction |
You can make additional fine adjustments to the time of a specific source. This is useful when the calibration process finds an alignment point for the sources, but they might not have been striped at the same time. |
|
Buffer Size |
Configures the size of the buffer for this source. When there is too much offset between two sources, this can be used to let one source buffer more data to get the alignment |
|
B.U. |
Number of buffer underflows detected. |
|
B.O. |
Number of buffer overflows detected. |
|
F.D. |
Number of frame drops detected. |
|
Timing Diagram |
The vertical line represents the evaluation time. The line is green when inside the buffer, and red when it's outside available samples. |
Buffer Visualizer
The Buffer Visualizer is a separate window to show a visualization of all the channels together. This is a larger, more comprehensive view of what's shown for each channel in the Timing Diagram column.

The buffers are represented with the following UI elements:
-
Vertical Line: Represents the evaluation time. The line is green when inside the buffer, and red when it's outside the available samples.
-
Light gray rectangle: Represents the current timed samples available in the channel.
-
Dark gray rectangle: Represents the average of the timed samples available in the channel.
-
White rectangle: Represents the standard deviation of the oldest timed sample and newest timed sample available.
The bigger the white rectangle is, the more variation or jitter in the sample's buffer. When you see this larger variation, you will probably need to allow more buffer between the evaluation time and the newest sample available to be sure you are always able to evaluate a sample at the desired time.
To open the Buffer Visualizer in the Timed Data Monitor:
-
Select the Open a buffer visualizer button at the top of the Timed Data Monitor window.
![image alt text]()

Calibration


The Timed Data Monitor includes functionality to calibrate all the enabled sources to find an alignment point. Calibration can be initiated from the Timed Data Monitor UI or through Blueprints .
During calibration, the Timed Data Monitor will modify the global offset of the TimecodeProvider and buffer sizes of the sources so that all channels have samples in the range of the evaluation time. By default, the standard deviation of time differences will be used to find a spot with more statistical assurance that it will always be aligned. The algorithm can be modified from the project settings.
Calibration Example
In the video, there are multiple LiveLink sources connected but not aligned. In the viewport, the actors are out of sync. In the Buffer Visualization window, you can see the misalignment: some sources have their samples too early; some contain the evaluation time; and some that are too late. One source LLTS.5 has a smaller buffer amount than the others.
When the calibration process starts, the algorithm:
-
Grows the LLTS.5 buffer size to be able to align it with the other samples.
-
Modifies the global offset on the TimecodeProvider to get all sources aligned. The offset selected is the smallest required to align LLTS.0 with the other samples since it was the furthest from the evaluation point.
Once calibration finishes, the buffers are all in the range of the evaluation time and all the actors are now in sync.
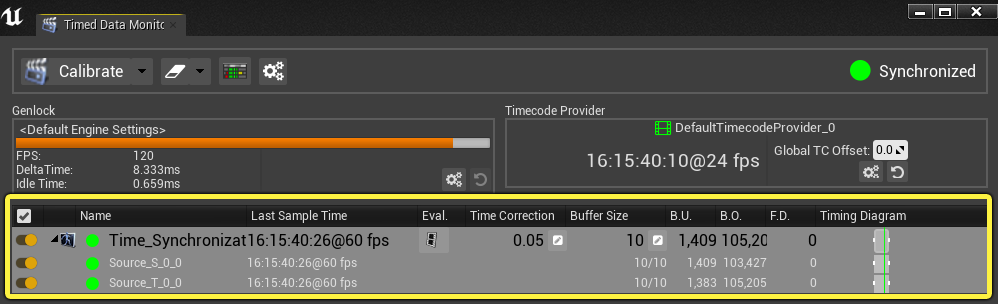
Timed Data Monitor State
In the top right corner of the Timed Data Monitor is a visualization of the global state of the incoming data and how it relates to the engine's time. The possible states include:
|
State |
Description |
|---|---|
|
Disabled |
Either no inputs are present or all inputs are disabled. |
|
Synchronized |
All enabled inputs have a sample matching the evaluation time. |
|
Outside Range |
One or more input doesn't have a sample matching the evaluation time. |
|
No Samples |
Inputs currently have no samples available. |
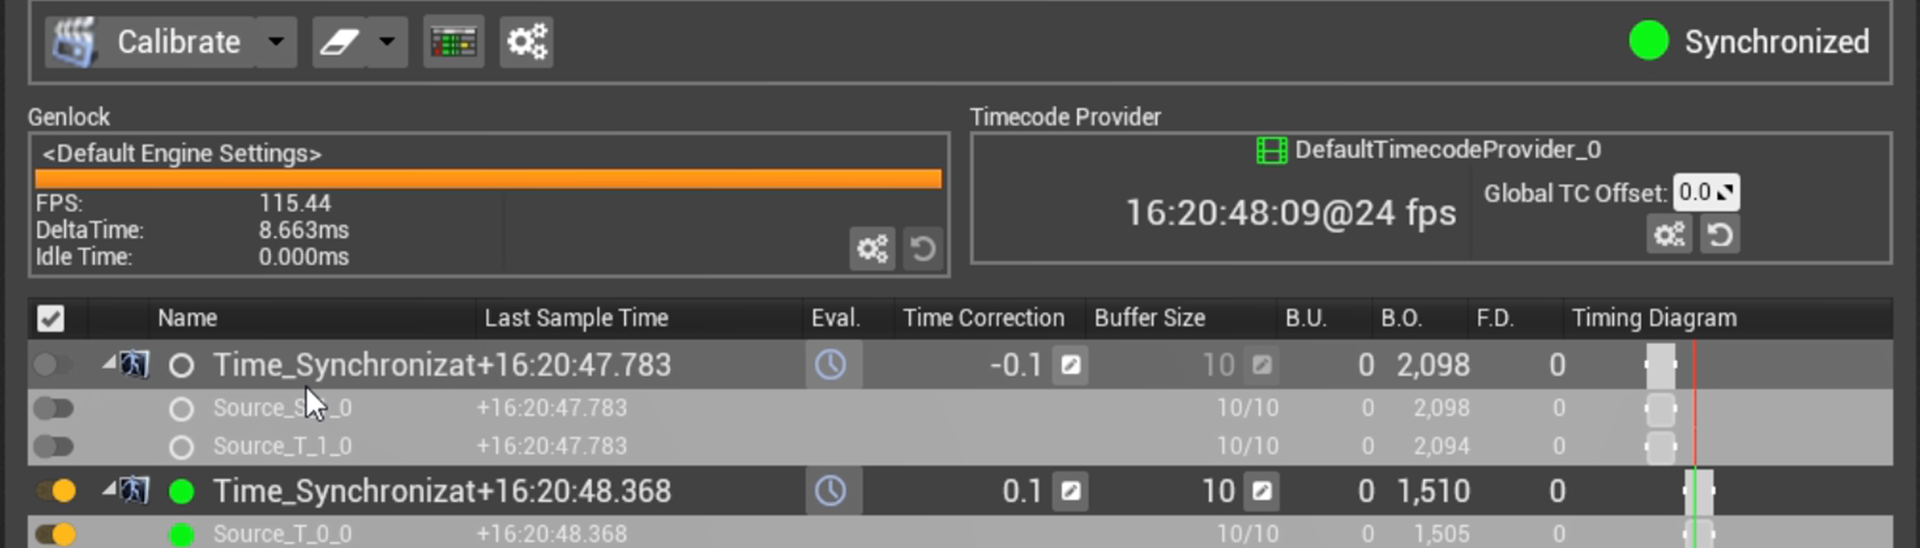
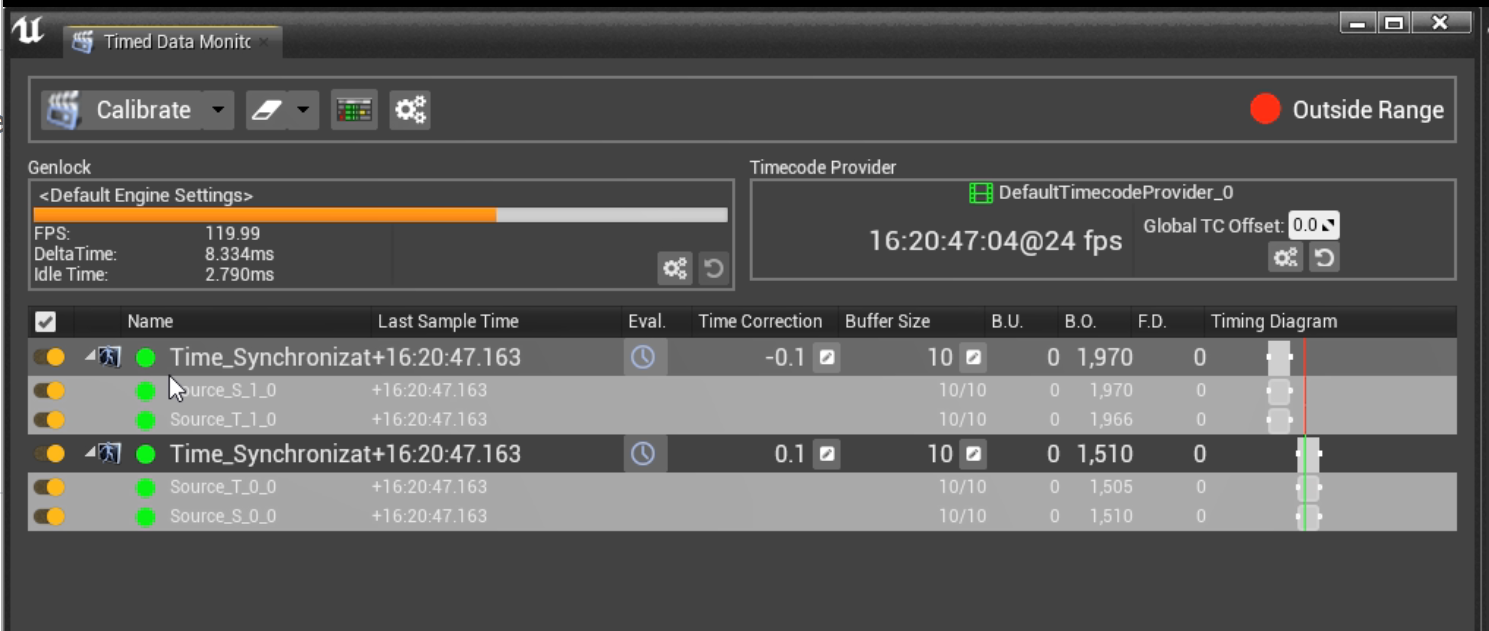
The example below shows how the sources can affect the global state of the monitor. In the example, there are two Live Link sources:
-
The Time Correction for the first source is set to -0.1. This puts the source out of sync with the engine's time, as represented by the red vertical line in the Timing Diagram .
-
The Time Correction for the second source is set to 0.1. This puts the source in sync with the engine's time, as represented by the green vertical line in the Timing Diagram .
When both sources are enabled, the global state is set to Outside Range , because the first source is out of sync with the engine's time. Disabling the first source switches the state to Synchronized , since only the second source was in sync with the engine's time.

Plugin Settings Reference
In the Plugin settings, there are many ways to customize the calibration process and the functionality of Timed Data Monitor in general. The table below describes all the settings and how they impact functionality in the tool.

Calibration
|
Parameter |
Description |
|---|---|
|
Calibration Settings |
|
|
Number of Retries |
Specifies how many times the calibration algorithm will be run to try to find an alignment for all inputs. |
|
Buffer Resize Allowed |
When enabled, the calibration algorithm can increase the buffer size of one or more inputs. |
|
Buffer Shrink Allowed |
When enabled, the calibration algorithm can shrink the buffer size of one or more inputs. |
|
Failed if Buffer Cant be Resize |
When enabled, if a buffer could not be resized, then the calibration process would fail. A buffer can fail to resize if it would become too big, for example. |
|
Use Standard Deviation |
Use the standard deviation stat when considering if an input has a sample in the range of the evaluation time. |
|
Number of Standard Deviation |
Specifies how many standard deviations should be considered to consider a sample in range. |
|
Reset Statistics Before Using Standard Deviation |
Allow resetting stats before doing the calibration. |
|
Amount Of Seconds to Wait After Statistic Reset |
Time to wait to let statistics settle in after a reset. |
|
Time Correction Settings |
|
|
Buffer Resize Allowed |
Time Correction algorithm can change the buffer size of one or more inputs if it finds that it's too big. |
|
Buffer Shrink Allowed |
Time correction algorithm can shrink buffer size of one or more inputs if it finds that it's too big. |
|
Failed If Buffer Cant be Resize |
If a buffer could not be resized (would be too big for example), fail the time correction process. |
|
Number of Standard Deviation |
Specifies how many standard deviations there should be. |
UI
|
Parameter |
Description |
|---|---|
|
Refresh Rate |
Interval at which the UI is refreshed. |
|
Reset |
|
|
Reset Buffer Stat Enabled |
When clicking the Reset button in the UI, reset buffer statistics by default. |
|
Clear Message Enabled |
When clicking the Reset button in the UI, clear logged messages by default. |
|
Reset Evaluation Time Enabled |
When clicking the Reset button in the UI, reset time correction of each input by default. |