UDN
Search public documentation:
HotSpotReportGeneration
日本語訳
中国翻译
한국어
Interested in the Unreal Engine?
Visit the Unreal Technology site.
Looking for jobs and company info?
Check out the Epic games site.
Questions about support via UDN?
Contact the UDN Staff
中国翻译
한국어
Interested in the Unreal Engine?
Visit the Unreal Technology site.
Looking for jobs and company info?
Check out the Epic games site.
Questions about support via UDN?
Contact the UDN Staff
UE3 Home > Performance, Profiling, and Optimization > Memory Usage and Profiling > Hot Spot Report Generation
Hot Spot Report Generation
- Hot Spot Report Generation
- Overview
- Creating Raw MemLeakCheck Data
- Creating CSVs To Pull Data From
- Parsing For Overall Trending Data
- Parsing Individual Level CSVs
- Preparing 'Human-Friendly' Hot Spot Reports For Level Designers
- Items To Be Called Out
- Items To Avoid
- Preparing A Followup Hot Spot Report
- Long Duration Runs
- Cold Spot Reports
Overview
Creating Raw MemLeakCheck Data
- Load up UnrealConsole, and connect to the instance of the game that will be used for this test.
- Launch into DebugConsole executable in the build you intend to capture from.
- Load into the SP level you intend to do a capture for.
- Once in the level use the following command:
The 30 denotes the number of seconds between memleakcheck captures. You can increase or decrease the frequency as necessary, but generally you will want to keep this number consistent in order to properly track trending over time.
DoMemLeakchecking 30 - Turn on
stat levelsto be able track when the P-level is going to change. - Progress through the entire P-level and transition to next P-level.
- After 2 captures into the P-level that you transition into back out to the main menu and/or reboot.
- Always reboot before starting another level capture.
- The memleakcheck files will be created in the following folder, depending on the platform being profiled:
- For PC/UDK:
[install]\[GameName]\Profiling\MEMLEAKS - For iOS (after backing up the documents directory to PC. See Deployment Tools for info on backing up the documents directory.):
[install]\[GameName]\iOS_Backups\[DeviceName]\Profiling\MemLeaks
- For PC/UDK:
- Each memleakfile will be parsed into a folder named after the level it was started in.
For example, if you began a capture in level-a, and progressed into level-b and level-c captures for this entire run would be in the level-a folder.
- Copy these memleakcheck files/folders into a location that can be reached easily.
Creating CSVs To Pull Data From
- Launch the memleakcheckdiffer.exe from the following folder:
..\Binaries\ - In the MemLeakCheckDiffer, Choose
File > Openall Memleak files in a folder and sub-folders - Browse, and Navigate to the folder where you placed your memleakcheck files.
- Wait for the folders to populate the MemLeakCheckDiffer.
- Once all of the folders have populated MemLeakCheckDiffer window, choose to
Generate Overall Report. - CSVs for each level will be generated, and a GlobalSummary CSV will also be created.
- CSVs are located inside the folder that your MemLeakCheck files were placed.
Parsing For Overall Trending Data
- Open the GlobalSummary spreadsheet in Excel.
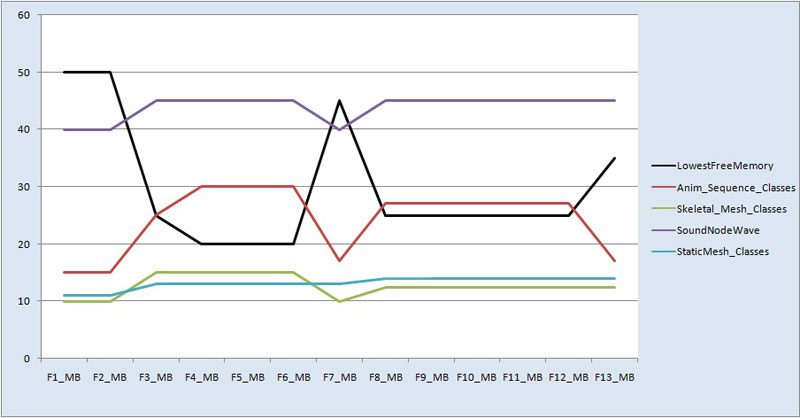
- To more easily visualize the content data, hide all of the rows outside of the following:
- LowestTFP
- AnimSequenceClasses
- SkeletalMesh_Classes
- SoundNodeWave
- StaticMesh_Classes
- Highlight these 5 rows starting with the bucket name and ending with the last value in the row.
- After they are selected, choose to
Insert > Line Graph. - This will give you a quick glimpse of the state of each of the content buckets as well as overall memory trending on the level.
Parsing Individual Level CSVs
Preparing 'Human-Friendly' Hot Spot Reports For Level Designers
The lowest memory reached during this test was 20 MB when the following sublevels were loaded :
 1st Dip
The following bugit loc will take you to the area of the level directly before this dip occurs:
During this dip Anim Sequence Classes increased 15 MB, Skeletal Mesh Classes increased 5 MB, Sound Node Waves increased 5 MB, and Static Mesh Classes increased 2 MB.
The following new sublevel(s) streamed in between the 3rd and 6th captures where the first part of this dip occurs:
During this dip Anim Sequence Classes increased 10 MB, Skeletal Mesh Classes increased 2.5 MB, Sound Node Waves increased 5 MB, and Static Mesh Classes increased 1 MB.
The following sub-levels streamed in during this 2nd dip, between the 8th and 12th captures:
- SP_Example_W
- SP_Example_02_boss
- SP_Example_02_S
- SP_Example_03
- SP_Example_04
 1st Dip
The following bugit loc will take you to the area of the level directly before this dip occurs:
BugItGo -1858.2000 -2162.7903 1572.0010 64073 -16686 0=
- SP_Example _Cine
BugItGo 904.3768 261.3029 1761.1804 -4788 -20256 72
- SP_Example_02_boss
- SP_Example_02_S
- SP_Example_03
Items To Be Called Out
Items To Avoid
Preparing A Followup Hot Spot Report
Long Duration Runs
domemleakchecking 30 command and play as far as possible. We run with reducepoolsize during these runs so we can get the longest stretch possible.
Using this data you can compare the difference between the individual level runs and continuous runs to get a basic memory delta between the two. Looking at this delta will give you an idea of how much overhead you will need to start building into individual levels, and will help to locate any memory leaks that may be happening.
