UDN
Search public documentation:
MemoryProfilingHome
日本語訳
中国翻译
한국어
Interested in the Unreal Engine?
Visit the Unreal Technology site.
Looking for jobs and company info?
Check out the Epic games site.
Questions about support via UDN?
Contact the UDN Staff
中国翻译
한국어
Interested in the Unreal Engine?
Visit the Unreal Technology site.
Looking for jobs and company info?
Check out the Epic games site.
Questions about support via UDN?
Contact the UDN Staff
UE3 Home > Performance, Profiling, and Optimization > Memory Usage and Profiling
Memory Usage and Profiling
- Memory Usage and Profiling
- Overview
- Debugging memory: Step by step
- Memory Tracking Tools and Techniques
- DVD Footprint
- Executable Size
- Always Loaded Content
- Content Cost Comparison
- Engine Memory Pools
- Hot Spot Reports
- MemLeakCheck Tracking
- Texture Pool
- TArray Slack
- Memory Fragmentation
- Stack Memory
- Finding Referenced Assets
- Memory On Consoles
Overview
Debugging memory: Step by step
- The level that has too many Static Meshes.
- AIs that create too many projectiles and particles.
- Code that allocates too much memory.
- Budget: Decide what to use memory on.
- Make sure all assets are optimal and don't have unnecessary references.
- Make sure you have enough buffer (for fragmentation) to keep your game running.
Memory Tracking Tools and Techniques
STAT LEVELS
TheSTAT LEVELS command can be used to see how many levels are loaded in memory.
- Red - Level is loaded and visible.
- Orange - Level is in the process of being made visible.
- Yellow - Level is loaded but not visible.
- Blue - Level is unloaded but still resident in memory, will be cleaned up when garbage collection occurs.
- Green - Level is unloaded.
- Purple - Level is preloading.
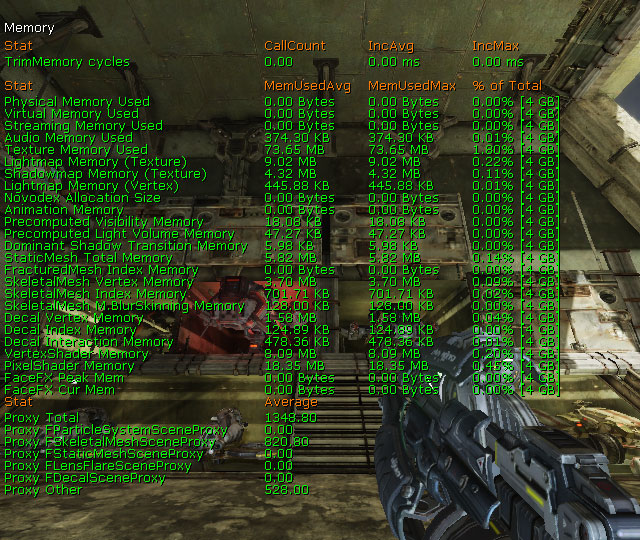
STAT MEMORY
TheSTAT MEMORY command provides a basic outline of assets' memory usage in the level
- Audio Memory
- Novodex Allocation
- Animation
- Vertex Lighting
- StaticMesh Vertex/Index
- SkeletalMesh Vertex/Index
- Decal Vertex/Index
- VertexShader
- PixelShader
- Texture Pool Size
- FaceFX
Content Cost Comparison
GAMENAME ContentComparisonCommandlet
NOTE: You probably want to run this nightly
This will break down the asset's total memory into a number of "key" categories for better comparison.
Those are currently located in the BaseEngine.ini and are the following:
[ContentComparisonReferenceTypes]
+Class=AnimSet
+Class=SkeletalMesh
+Class=SoundCue
+Class=StaticMesh
+Class=Texture2D
We are using these attributes as they usually represent the majority of memory usage and are also the easiest to compare across assets. For example, if you have N weapons. You can probably break them up into: Small, Medium, and Large weapons. In general we don't want to have small weapons cost more than Large weapon. So being able to visualize how much each weapon cost is a great way to make certain our costs are in line. More generally, we want to have a really low standard deviation across our asset types. Example: If we have N similiar characters, we don't want one character to cost 1.5 to 2.0 times more than all the other characters in terms of SkeletalMesh. There are lots of reasons why a character could end up costing more than others. And some of those reasons are just ignorance. The idea with this commandlet is to list out the costs and then make certain they fall in line with our expectations. This also provides a nice way to investigate outliers. To set up which classes the
ContentComparisionCommandlet looks at modify DefaultEditor.ini ContentComparisonClassesToCompare
Content Histograms
Seeing that you have 15 megs of sounds always loaded in nice to know. But what are those sounds? If you do "listsounds" you get a huge list of hundreds of sounds, which is pretty painful to get an idea of what the distribution is. The same occurs for textures where you have hundreds of textures loaded. Getting a quick high level view of what TYPES of sounds are in memory can save you lots of time. If the percentages are correct then everything is Good. But if you see that you are using 40% of your sound budget on footstep sounds that gives you a quick place to optimize. By using a combination of MemLeakCheck and xls spreadsheets you can make useful histograms. A sample .xls file that can be used for sounds and textures is provided: SoundTextureHistograms.xlsx Load up your level and then:- Run MemLeakCheck
- Copy and paste out the list of Sounds into the SoundData tab in the .xls
- Copy and paste out the list of Textures into the TextureData tab in the .xls
- The .xls will then give you each category and the amount of memory used by that category
Engine Memory Pools
- Name Table
- Octree
- RB_BodyInstance Pool (c.f. DISABLE_POOLED_RB_INSTANCES)
- RB_ConstraintInstance Pool (c.f. DISABLE_POOLED_RB_INSTANCES)
- Static Mesh Collision Scales
- Static Draw lists on render thread
- Particles if using the EmitterPool
- Decals if using the DecalManager
Hot Spot Reports
MemLeakCheck Tracking
Texture Pool
stat streaming command will display texture streaming stats. The stats you care about are:
- Streaming Fudge Factor: We want this to be as close to 1.0f as possible
- Over Budget: We want this to be as close to 0.0f as possible
listtextures console command displays all of the textures currently in the pool and their current size. Looking at that list will allow you to see if there are questionable textures existing in the pool!
In the Editor there is the TextureStats tab. Running through your level in PIE and then looking at that tab will show a lot of stats about Textures. One of the really important ones is the "Last Seen(sec)" column. If you have a texture in that is never seen even tho it is referenced, then that is a candidate for looking to see where it is used and perhaps removing it!
All textures except render targets use texture pool. This includes lightmaps. (Using lightmaps instead of vertex lighting is a clear win on memory savings because they won't fluctuate system memory.)
Also make sure you have an optimal texture pool size for your game. Stat Memory will show how much of texture pool is being used. Based on that, you'll be able to determine the best number for your game.
In DefaultEngine.ini:
[TextureStreaming]
PoolSize=120
Memory Fragmentation
Finding Referenced Assets
Memleakcheck prints a lot of basic game data to one output file as text file in [ProfileDirectory:Platform-specific]/MemLeak.
This will at least show you the snapshot of object list of Skeletal Meshes, AnimSets, Sounds, and so on. Once you have a basic snapshot, you can go through them and see if there are unnecessary assets loaded. If so, trace it down to who references it and remove the reference is the key to the solution.
Below is the case study...
OBJ LIST CLASS=SKELETALMESH:
Lists all SkeletalMeshes loaded, sorted by size. MEMLEAKCHECK includes this information, but it is sorted alphabetically, which makes it hard to find content to optimize.
LISTSOUNDS:
Lists all SoundCues loaded, sorted by size. MEMLEAKCHECK includes this information, but it is also sorted alphabetically, which makes it hard to find content to optimize.
OBJ LIST CLASS=STATICMESH:
Lists all StaticMeshes loaded, sorted by size.
LISTANIMSETS:
Lists all AnimSets loaded, sorted by size. MEMLEAKCHECK also includes this info.
OBJ REFS:
The most useful way to find why an asset is being loaded is using the OBJ REFS command. To use this, you need to run the game on PC, as it requires a deep stack due to the recursive functions and usually crashes the console versions of UE3.
Play to the point where the asset in question is loaded, and then type: OBJ REFS CLASS= NAME=
For example:
OBJ REFS CLASS=SKELETALMESH NAME=BIG_OGRE_2It will then show what the chain of references is that is pulling in this asset e.g.:
Log: Shortest reachability from root to SkeletalMesh COG_Bolo_Grenade.Frag_Grenade:
Log:    SkeletalMesh COG_Bolo_Grenade.Frag_Grenade [target] (root) (standalone)
Log:    SkeletalMeshComponent GearGame.Default__GearProj_FragGrenade:COGGrenadeMesh0 (root) (ObjectProperty Engine.SkeletalMeshComponent:SkeletalMesh)
Log:    Class GearGame.GearProj_FragGrenade (root) (standalone)
In the example above, the Frag_Grenade mesh is being referenced by the default properties of the GearProj_FragGrenade native class. Note that there may be more than one reference, in which case you will have to take care of them one at a time. Here are some reasons we have found for assets being incorrectly loaded:
- The asset is referenced by a native class.
- UnrealScript code references the class (that references the asset) to get a default property from it:
Asset = class'MyGameContent.Pawn_BigOgre'.default.Mesh.PhysicsAsset;
- A Touch Kismet event (SeqEvt_Touch) references the class in its ClassProximityTypes or IgnoredClassProximityTypes arrays.