UDN
Search public documentation:
GameplayProfiler
日本語訳
中国翻译
한국어
Interested in the Unreal Engine?
Visit the Unreal Technology site.
Looking for jobs and company info?
Check out the Epic games site.
Questions about support via UDN?
Contact the UDN Staff
中国翻译
한국어
Interested in the Unreal Engine?
Visit the Unreal Technology site.
Looking for jobs and company info?
Check out the Epic games site.
Questions about support via UDN?
Contact the UDN Staff
UE3 Home > Performance, Profiling, & Optimization > Gameplay Profiler
UE3 Home > Gameplay Programming > Gameplay Profiler
UE3 Home > Gameplay Programming > Gameplay Profiler
Gameplay Profiler
Overview
Creating a Profile
PROFILEGAME START console command and stop it by running PROFILEGAME STOP at the console. Alternatively you can use PROFILEGAME 10 to capture 10 seconds worth of gameplay.
A .gprof file is being written to your [GameName]\Profiling\ folder and is automatically copied to the host PC on console. Beware that the files can get large fairly fast so it's best to only profile around hotspots for say 10-30 seconds.
Viewing a Profile
GameplayProfiler.exe. and either push the File Open button and navigate to the .gprof file you wish to open or simply pass in the file on the command line.
Note: The gameplay profiler executable can be found in the Binaries directory of the UE3 or UDK distribution.
Output
 The types of data are:
- Blue - Script functions
- Red - Native code
- Purple - Levels
- Green - Actors
- Olive - Components
- Orange - Classes
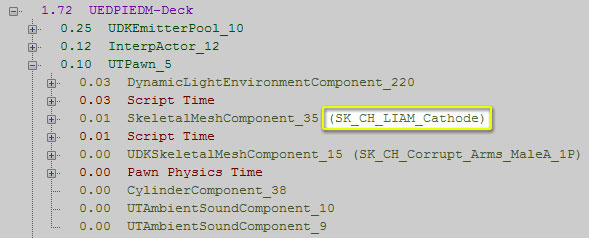
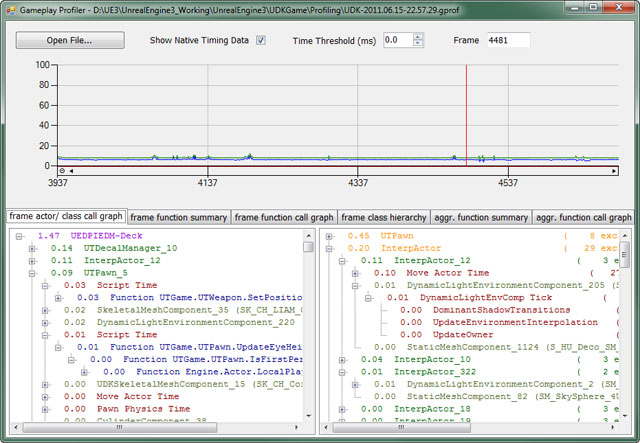
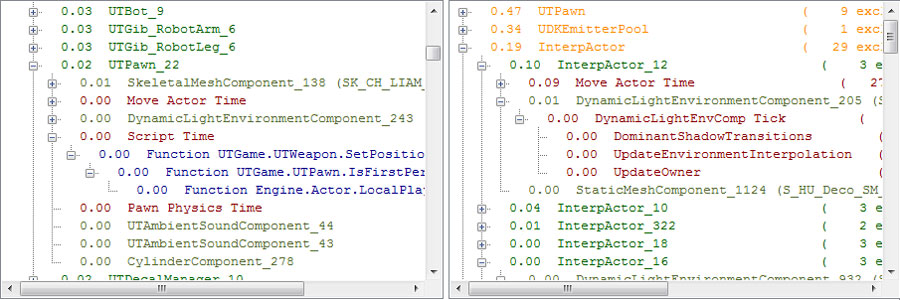
Actor/ class call graph
This view is split into two separate call graphs. On the left side is a level -> actor -> component/ function hierarchy for the selected frame that shows each instance individually, whereof on the right side is a grouping by actor class -> actor -> component/ function. You can use the left side to see which levels are hot in a multi-level scenario (usually the persistant one that has object spawned in it) or look at the relative cost of certain objects. The right view is useful when figuring out which types of objects are taking time and you can also see how many instances of a class there are. The inclusive and exclusive numbers displayed there represent the number of inclusive and exclusive child nodes in the tree before culling. A high inclusive number usually means a lot of different script functions were called.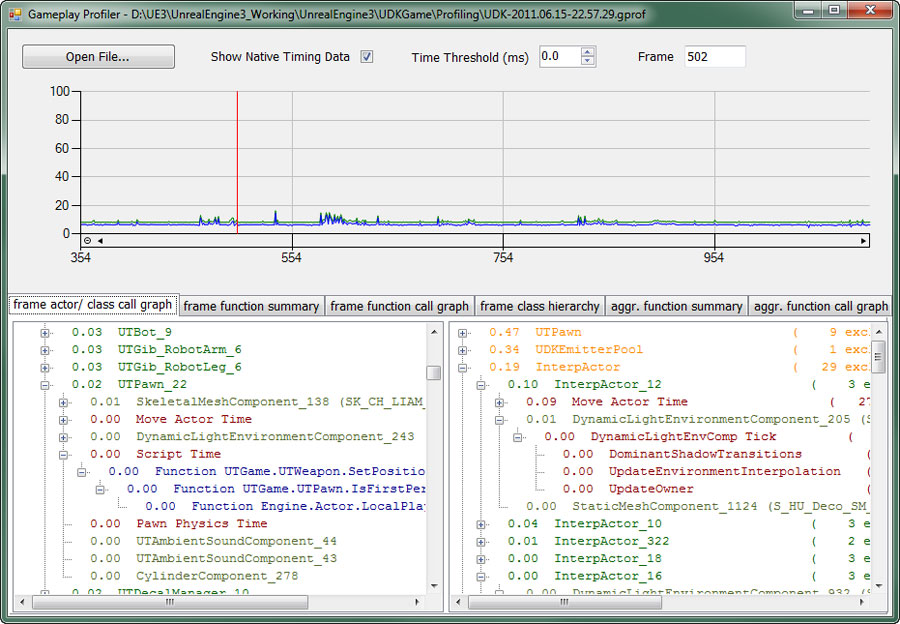
Function summary
This view shows each script function called during the selected frame with inclusive and exclusive time, call count and the ratios of inclusive and exclusive time per call. You can sort by a column in descending order by simply clicking on it. The only exception is the function name column, which is always sorted in ascending order.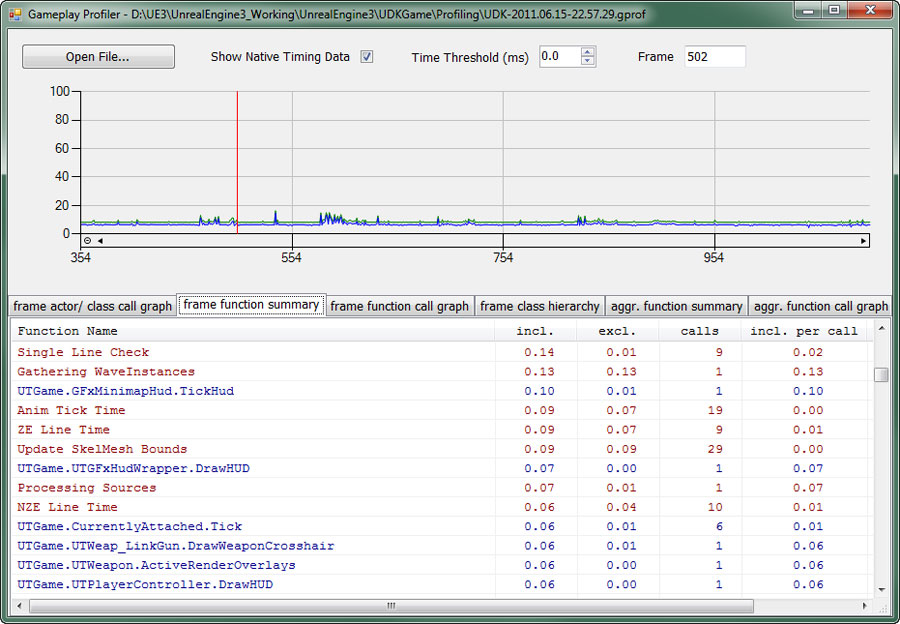
Class hierarchy
The class hierarchy is a per class view of cost split into actor, actor component and function top level nodes. Worth noting that most actor component and function time is already accounted for by the actor time so you can't simply add up those numbers. This view can be used to easily explore the class hierarchy and e.g. check how much time was spent ticking AI or how much time was spent in executing UnrealScript.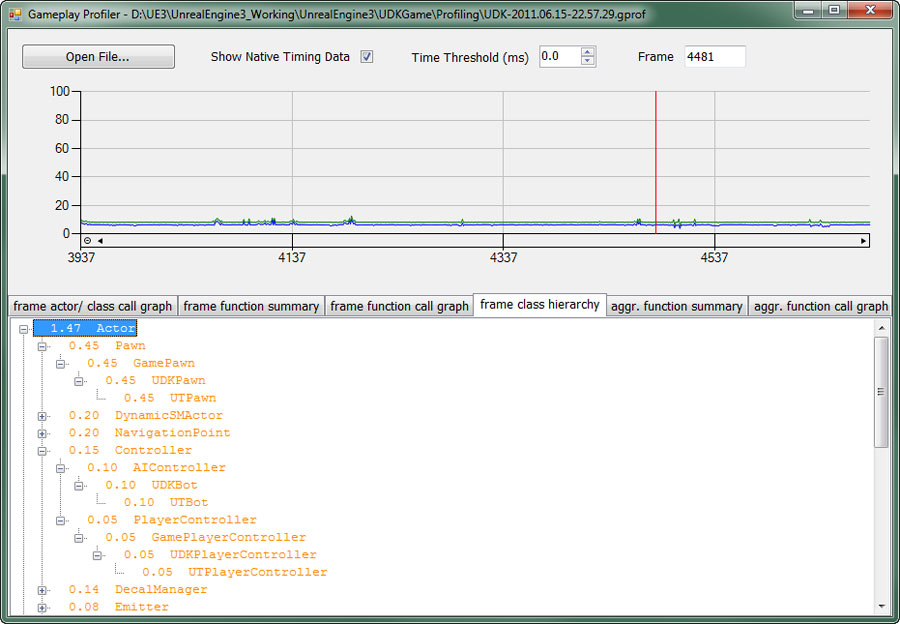
Function call graph
This tab shows a call graph for the currently selected frame.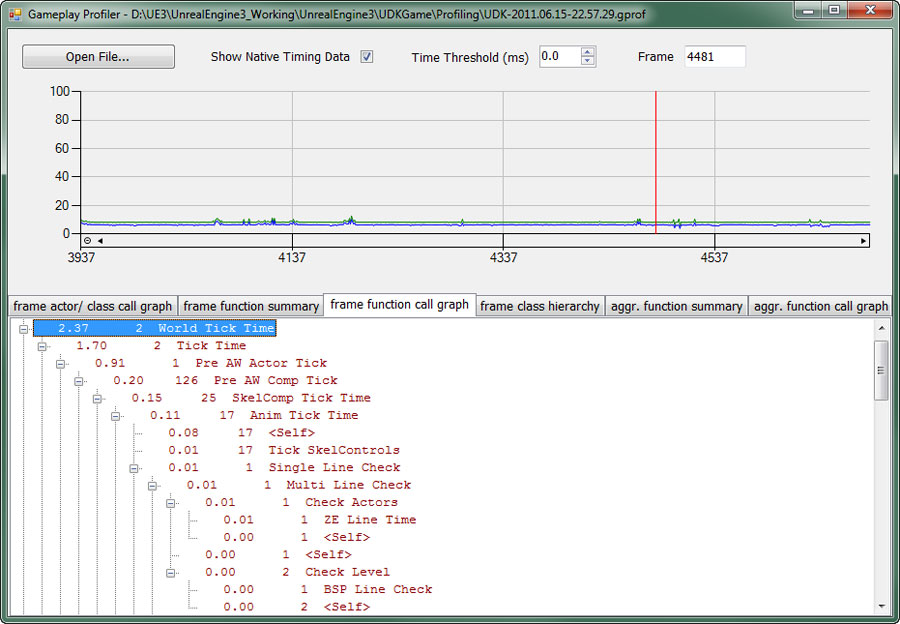
Aggregate function summary
This tab is similar to the function summary tab, albeit it aggregates the information for the entire capture duration. Inclusive and exclusive duration and call count are aggregated, max inclusive and max exclusive are the respective maxima for a single frame and the rest of the values are frame averages.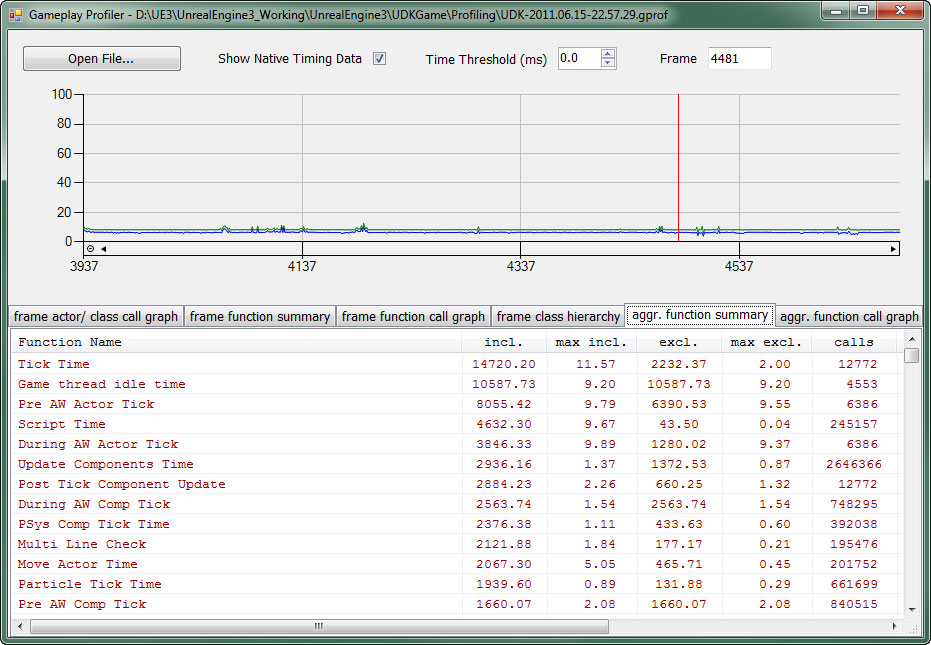
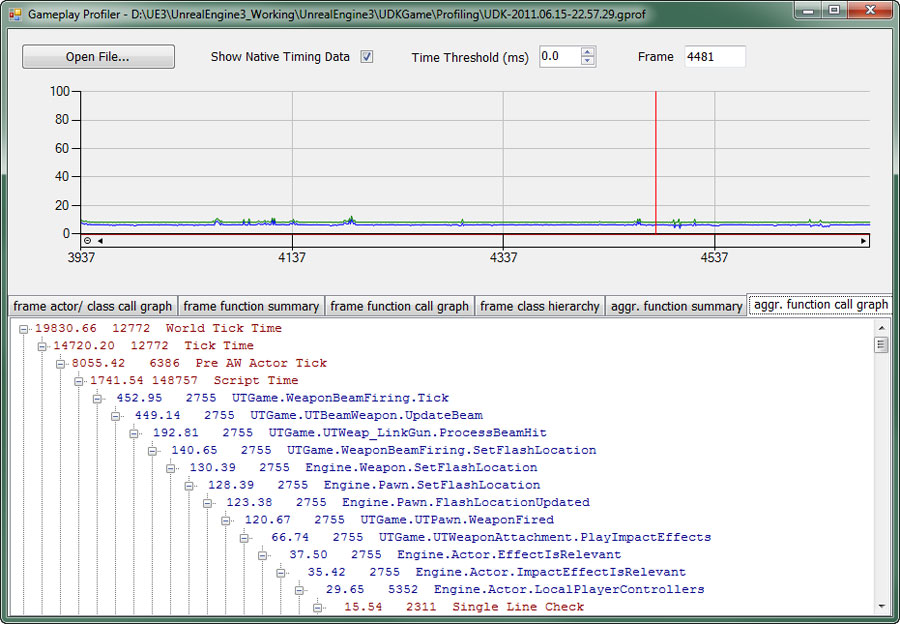
Aggregate function call graph
A call graph for all executaged functions, aggregated over the entire capture duration.